Live Application Information
The Spring Tools 4 can connect to running Spring processes to visualize internal information of those running Spring processes inline with your source code. This allows you to see, for example, which beans have bean created at runtime, how they are wired, and more.
The Spring Tools 4 shows hints by highlighting sections of source code with a light green background. Hovering over the highlights with the mouse pointer, data from the running app is displayed in a popup.
For some types of information, Spring Tools 4 may also show a 'quick summary' as a codelens. Codelenses are supported in Eclipse, VS Code and Theia. For Eclipse this has to be enabled via Preferences >> Language Servers >> Spring Language Servers >> Spring Boot Language Server.
If there are multiple instances of the app running on your machine, the live data from all those instances will show up in the hover information.

Live information is scraped from running apps using JMX to connect to Spring Boot Actuator Endpoints. This means that spring-boot-actuator must be added as a dependency to your application and enabled. The easiest way to accomplish this is to add the spring-boot-actuator-starter dependency to your application's pom.xml or build.gradle as explained here.
The JMX versions of the actuator endpoints (which the tooling uses under the hood to retrieve live data from the running applications) is not enabled by default anymore since Spring Boot 2.2. In order to allow Spring Tools 4 to continue to visualize live data from the running applications, you need to start the boot app with -Dspring.jmx.enabled=true in order to activate the JMX endpoints.
Eclipse: the Eclipse-based distributions of the Spring Tools 4 provide specific launch configurations when running Spring Boot apps that enable this setting automatically. So when starting your Spring Boot app from within Eclipse using a Spring Boot launch config, you don't need to do anything manually.
Visual Studio Code/Theia: in order to enable this when launching your Spring Boot application from within VSCode or Theia, you have to add "vmArgs": "-Dspring.jmx.enabled=true" mannually in launch.json, or launch the app directly from the boot dashboard extension.
The Spring Tools 4 can gather live hover informations for regular, non-Boot Spring applications as well. To allow the tools to connect to those running applications and gather live bean information from them, you need to start those Spring apps with a specific system preference being set in your launch configuration: -Dspring.liveBeansView.mbeanDomain.
In case you run your Spring app in a local Tomcat, you need to set this VM argument in the launch configuration of the Tomcat server.
Please not that this feature for non-Boot Spring applications is limited to bean definitions and their wirings (see below for more details). Other live hover information (like request mappings, conditions, etc.) are not supported yet. Also projects need to use at least Spring 4.3 or beyond.
There is a minimal UI provided by both Eclipse and Vscode Spring Boot support to allow a user to explicitly connect / refresh / disconnect to running processes that are accessible on the local machine. This includes both processes running locally, as well as remote processes that are accessible via JMX over an ssh tunnel.
In previous versions the spring boot language server would automatically try to connect to any JVM processes it could see.
As of STS 4.4.1 this is now only the case for processes that are launched directly from the Spring Boot Dashboard in Eclipse. (For remote processes the 'JMX tunnel' option must also be enabled when the app is deployed). This automation can be disabled via a Eclipse preference under "Window >> Preferences >> Language Server >> Spring Boot Language Server":
![]()
Instead of the automated process there is now a minimal UI that allows the user to explicitly
- select a process and connect to it and collect data.
- refresh the data from a connected process
- disconnect from a connected process
The 'Quick Access' is a search box at the top-right of your workspace window:
Type the word live in the box and the relevant commands will be revealed:

The same commands that can be accessed from Eclipse Quick Access can also be accessed from the boot dashboard from three different places:
From the Context Menu of a running Boot Application node:

From the Boot Dashboard view's menu:

From the lightbulb menu button in the toolbar:

All the menus work in a similar way and will try to filter the command's shown based on the currently selected nodes in the tree. Specificially:
-
if one or more applications are selected then a filter is applied so that only commands that relate to processes corresponding to the selected elements will be displayed in the menu.
-
if no applications are currently selected. No filter is applied and commands relating to all known processes are shown, whether or not they have a known relation to an element displayed in the Boot Dash or not. This option is useful to connect to processes that were not launched via the Boot Dashboard itself (if any element is selected, the filter associated with that element would remove the command from the menu).
In Visual Studio Code or Theia, invoke the command palette (e.g. via CTRL-SHIFT-P or CMD-SHIFT-P on Mac) and select the command to "Manage Live Spring Boot Process Connections". A choice of actions to connect/refresh/disconnect to local processes found on your machine will then be presented.
This section provides an overview of the different types of live information that are currently supported and how each of them can be accessed from the editor.
Live Request Mappings information is displayed for a running Spring Boot application. Live Request Mappings data is fetched from the application process. The data is mapped onto the Request Mappings definitions in the source code. A typical Request Mapping definition is the @RequestMapping annotation. Such spots in the source code are highlighted with the light green background.
Hovering over such place in the source code displays Live Request Mapping information hover which shows the following:
- List of Live Request Mapping URLs defined by the Request Mapping definitions (hyper-links)
- Process information from which Live Request Mappings data has been fetched from
Code Lens is displayed on a dedicated line right above the green highlight in the source code. The Live Request Mapping URLs are displayed in a single line. Clicking on a URL opens this URL in the browser.
Both the hover and the Code Lens support multiple running Boot apps.

Spring Boot collects basic metrics information for each RESTful endpoint. The live application information for request mappings display a summary of those metrics. Since the live information is not refreshed automatically or periodically, you need to hit the refresh action in order to display the metrics for request mapping endpoints in the source code. Keep in mind that initially, right after you started the app, the live information is display automatically (at least in many cases) and due to the lack of the endpoint already being executed does not show any metrics information. As soon as you invoke the endpoint (once or several times) and hit the live information refresh action, the metrics will appear and give you an idea about how much time was spend at this endpoint.

Live Beans information is displayed for a running Spring Boot application. Live Beans data is fetched from the application process. The data is mapped right onto the source code. Namely at the source code pieces where beans are injected or defined. Typically such places in the source code are Spring annotations but there are other places such as Component constructors, Spring Data repositories etc. These spots in the source code are highlighted with light green background.
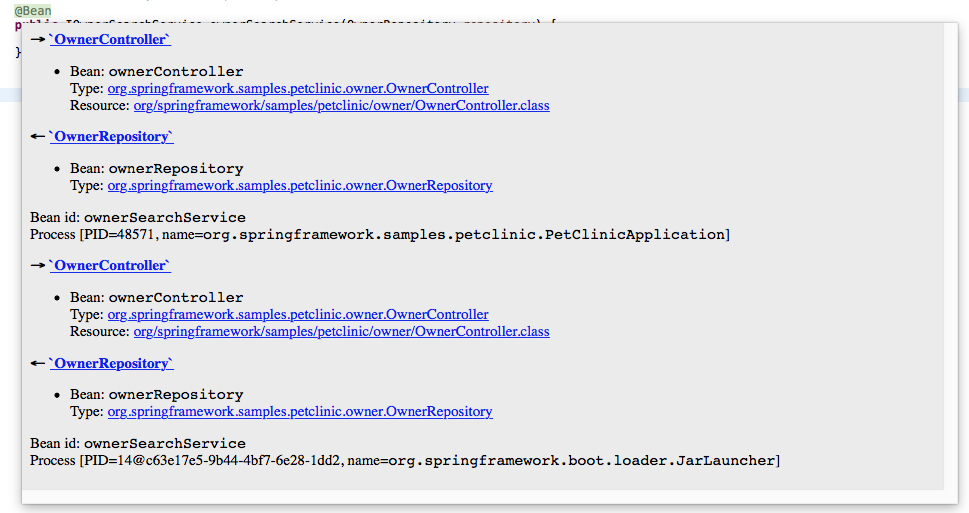
Live Beans hover is displayed when hovering over green highlights in the source code where beans are injected or defined. Typical Live Bean hover displays the following:
- List of beans current bean is injected into. Short summary list of beans in a single line followed by the detailed beans list
- List of beans wired into the current bean. Short summary list of beans in a single line followed by the detailed beans list
- Process information from which Live Beans data has been fetched from
Detailed list of beans provides for each bean the following:
- Bean ID
- Bean Java type (hyper-link)
- Resource defining the bean (hyper-link)

The hover can display Live Beans information for more than one running app as you can see below:
Code Lens is displayed on a dedicated line right above the green highlight in the source code. The Live Bean information displayed by the Code Lens is a short one line summary list of wired in beans and injected into beans for the current bean.

Spring Boot can collect information about how much time was spend during startup to initialize a specific bean. In order to collect this startup data, you need to modify the startup of your Spring Boot app slightly and use a buffering application startup. So instead of starting up your boot app like this:
SpringApplication.run(PetClinicApplication.class, args);
You need to use a buffering startup instead:
SpringApplication app = new SpringApplication(PetClinicApplication.class);
app.setApplicationStartup(new BufferingApplicationStartup(1000));
app.run(args);
Once you have this modification in place and start your app, the startup metrics will show up as part of the live application information for beans across the place (in the live hovers as well as in place with the code as part of the code lens):

Live conditional information is shown for running Spring Boot applications, if the conditions are matched at runtime. As with other live information, the @ConditionalOn... is highlighted in green when that conditional information is available.

Hovering over the highlighted conditional will display:
- Conditional matching information
- Process information from where the Live Conditional information was fetched

Hovering over a @Profile will show which profiles are currently active in running boot applications.
Additionally, the names of the profiles inside the annotation parameters will be highlighted, dependending on whether that specific profile is active.

TLDR; If an app is deployed to cloudfoundry using the STS 4 Eclipse Spring Boot Dashboard, there is an option to enable JMX at the bottom of the deployment dialog:

Once the app is deployed. Live hovers will work automatically for that remotely deployed application.
Live information is scraped from actuator-enabled apps using JMX. For local apps a JMX connection can be established automatically and doesn't require any special actions to enable JMX.
However, for remote apps the tools cannot automatically discover the process nor enable JMX support on the remote JVM. So besides needing to have actuator enabled (this is the same as for local apps) there are some additional requirements for remote apps:
- JMX must be explicitly enabled on the remote JVM when it is launched. This is done by setting certain system properties.
- The remote host and port on which the remote JMX service is running must be made accessible from the local machine somehow.
- The Editor must be explicitly configured to know where to find the remote JMX service.
There are two ways to satisfy these additional requirements. An easy automatic way (this only works for apps deployed directly from the workspace to cloudfoundry); and a more involved, manual way.
When deploying an app to Cloudfoundry there is an option near the bottom of the Deployment Dialog where you can enable JMX.
What happens under the hood:
- JMX is enabled on the deployed application by setting additional system properties via the
JAVA_OPTSenvironment variable. - When the app has fully started a local SSH tunnel is created, proxying the JMX service on a local port.
- The editor is configured with a JMX url pointing to that local port.
This makes live hover information work for the remote application.
Note: You can find the exact and full url for the local tunnel proxy in the property page for the deployed app in the Boot Dashboard. To access this page, right click the deployed app node and select the 'Show Properties' action.

On the property page you can then find a property called 'JMX URL'.

You can copy this url into your clipboard and then use it, for example to connect jconsole to your remote app and inspect it. This process should also work for any other tool that works over JMX.
You can also set this up manually. This may, for example, be necessary if you don't deploy your application directly from the workspace but use a CI/CD pipeline for deployment. Here we explain the process for an app deployed to Cloudfoundry, but in principle this process can also be adapted to any actuator-enabled spring-boot app, running anywhere.
Step 1: Enabling JMX.
This can be accomplished by adding system properties via the JAVA_OPTS environment variable. For example you could add this to your cf manifest.yml:
env:
  JAVA_OPTS: >
    -Dcom.sun.management.jmxremote.ssl=false
    -Dcom.sun.management.jmxremote.authenticate=false
    -Dcom.sun.management.jmxremote.port=33333
    -Dcom.sun.management.jmxremote.rmi.port=33333
    -Djava.rmi.server.hostname=localhost
    -Dcom.sun.management.jmxremote.local.only=false
Step 2: Creating an SSH tunnel
You can use the CF CLI to create a tunnel to the deployed app. For example:
$ cf ssh my-app-name -L 33333:localhost:33333
This will create an SSH session and open a bash prompt connected to the remote app. As long as this session is left open, JMX for that app can now be accessed on the local port (33333 in the example).
Note: Due to some JMX implementation details, you must use the same local and remote port numbers (both are 33333 in the example). If you attempt to change the local port without also changing the remote port to the same number, then it will not be possible to establish a JMX connection over the resulting SSH tunnel.
You can verify your tunnel is setup correctly by attempting to connect to the remote JVM with jconsole using this command jconsole localhost:33333.
Step 3: Configure the Editor
The final step differs slightly depending on the Editor you are using (Eclipse / Vscode / Atom). But each of the editors are configured by pasting an identical json snippet into a specific setting. The snippet should look something like the following:
[
    {
        "jmxurl" : "service:jmx:rmi://localhost:33333/jndi/rmi://localhost:33333/jmxrmi",
        "host" : "my-app-host-for-http.cfapps.io"
    }
]
Note that the snippet is a json list, so you can configure more than one remote app at the same time.
For Eclipse, paste this snippet into Preferences >> Language Servers >> Spring Language Servers >> Spring Boot Language Server >> Remote Boot Apps.
For Vscode, enter it as the value for the configuration key boot-java.remote-apps (in either user or workspace settings).
For Atom, enter it as the value in Atom's Config JSON for property "remote-apps" inside the object value of "boot-java" property