
Production-Ready Observability for Node.js
Zero npm-dependency middleware that prevents Express servers from crashing and provides built-in monitoring — all from a single line of code.

npm install crashlessimport express from 'express';
import crashless from 'crashless';
const app = express();
app.use(crashless()); // 🎉 That's it!
app.get('/users/:id', async (req, res) => {
const user = await db.getUser(req.params.id); // 🛡️ Errors safely caught
res.json(user);
});
app.listen(3000);🖥️ Dashboard: http://localhost:3000/_crashless
Simplest possible setup
All features enabled
OTel metrics & traces
Prometheus-compatible metrics
Sentry, Datadog integrations
Secure production setup
Or clone locally:
git clone https://github.com/sunnyghodeswar/crashless-examples.git
cd crashless-examples && npm install📖 Complete Docs
Full documentation site
🚀 Getting Started
Installation & setup guide
⚙️ Configuration
All configuration options
📋 API Reference
Complete API documentation
💡 Examples
Common use cases & patterns
⚡ Performance
Benchmarks & optimization
Catch all errors automatically—sync, async, and promises. No try-catch needed.
app.use(crashless());

// Async errors - automatically caught
app.get('/data', async (req, res) => {
  const data = await fetchData(); // 🛡️ Safe
  res.json(data);
});

// Sync errors - also caught
app.get('/test', (req, res) => {
  throw new Error('Oops'); // 🛡️ Safe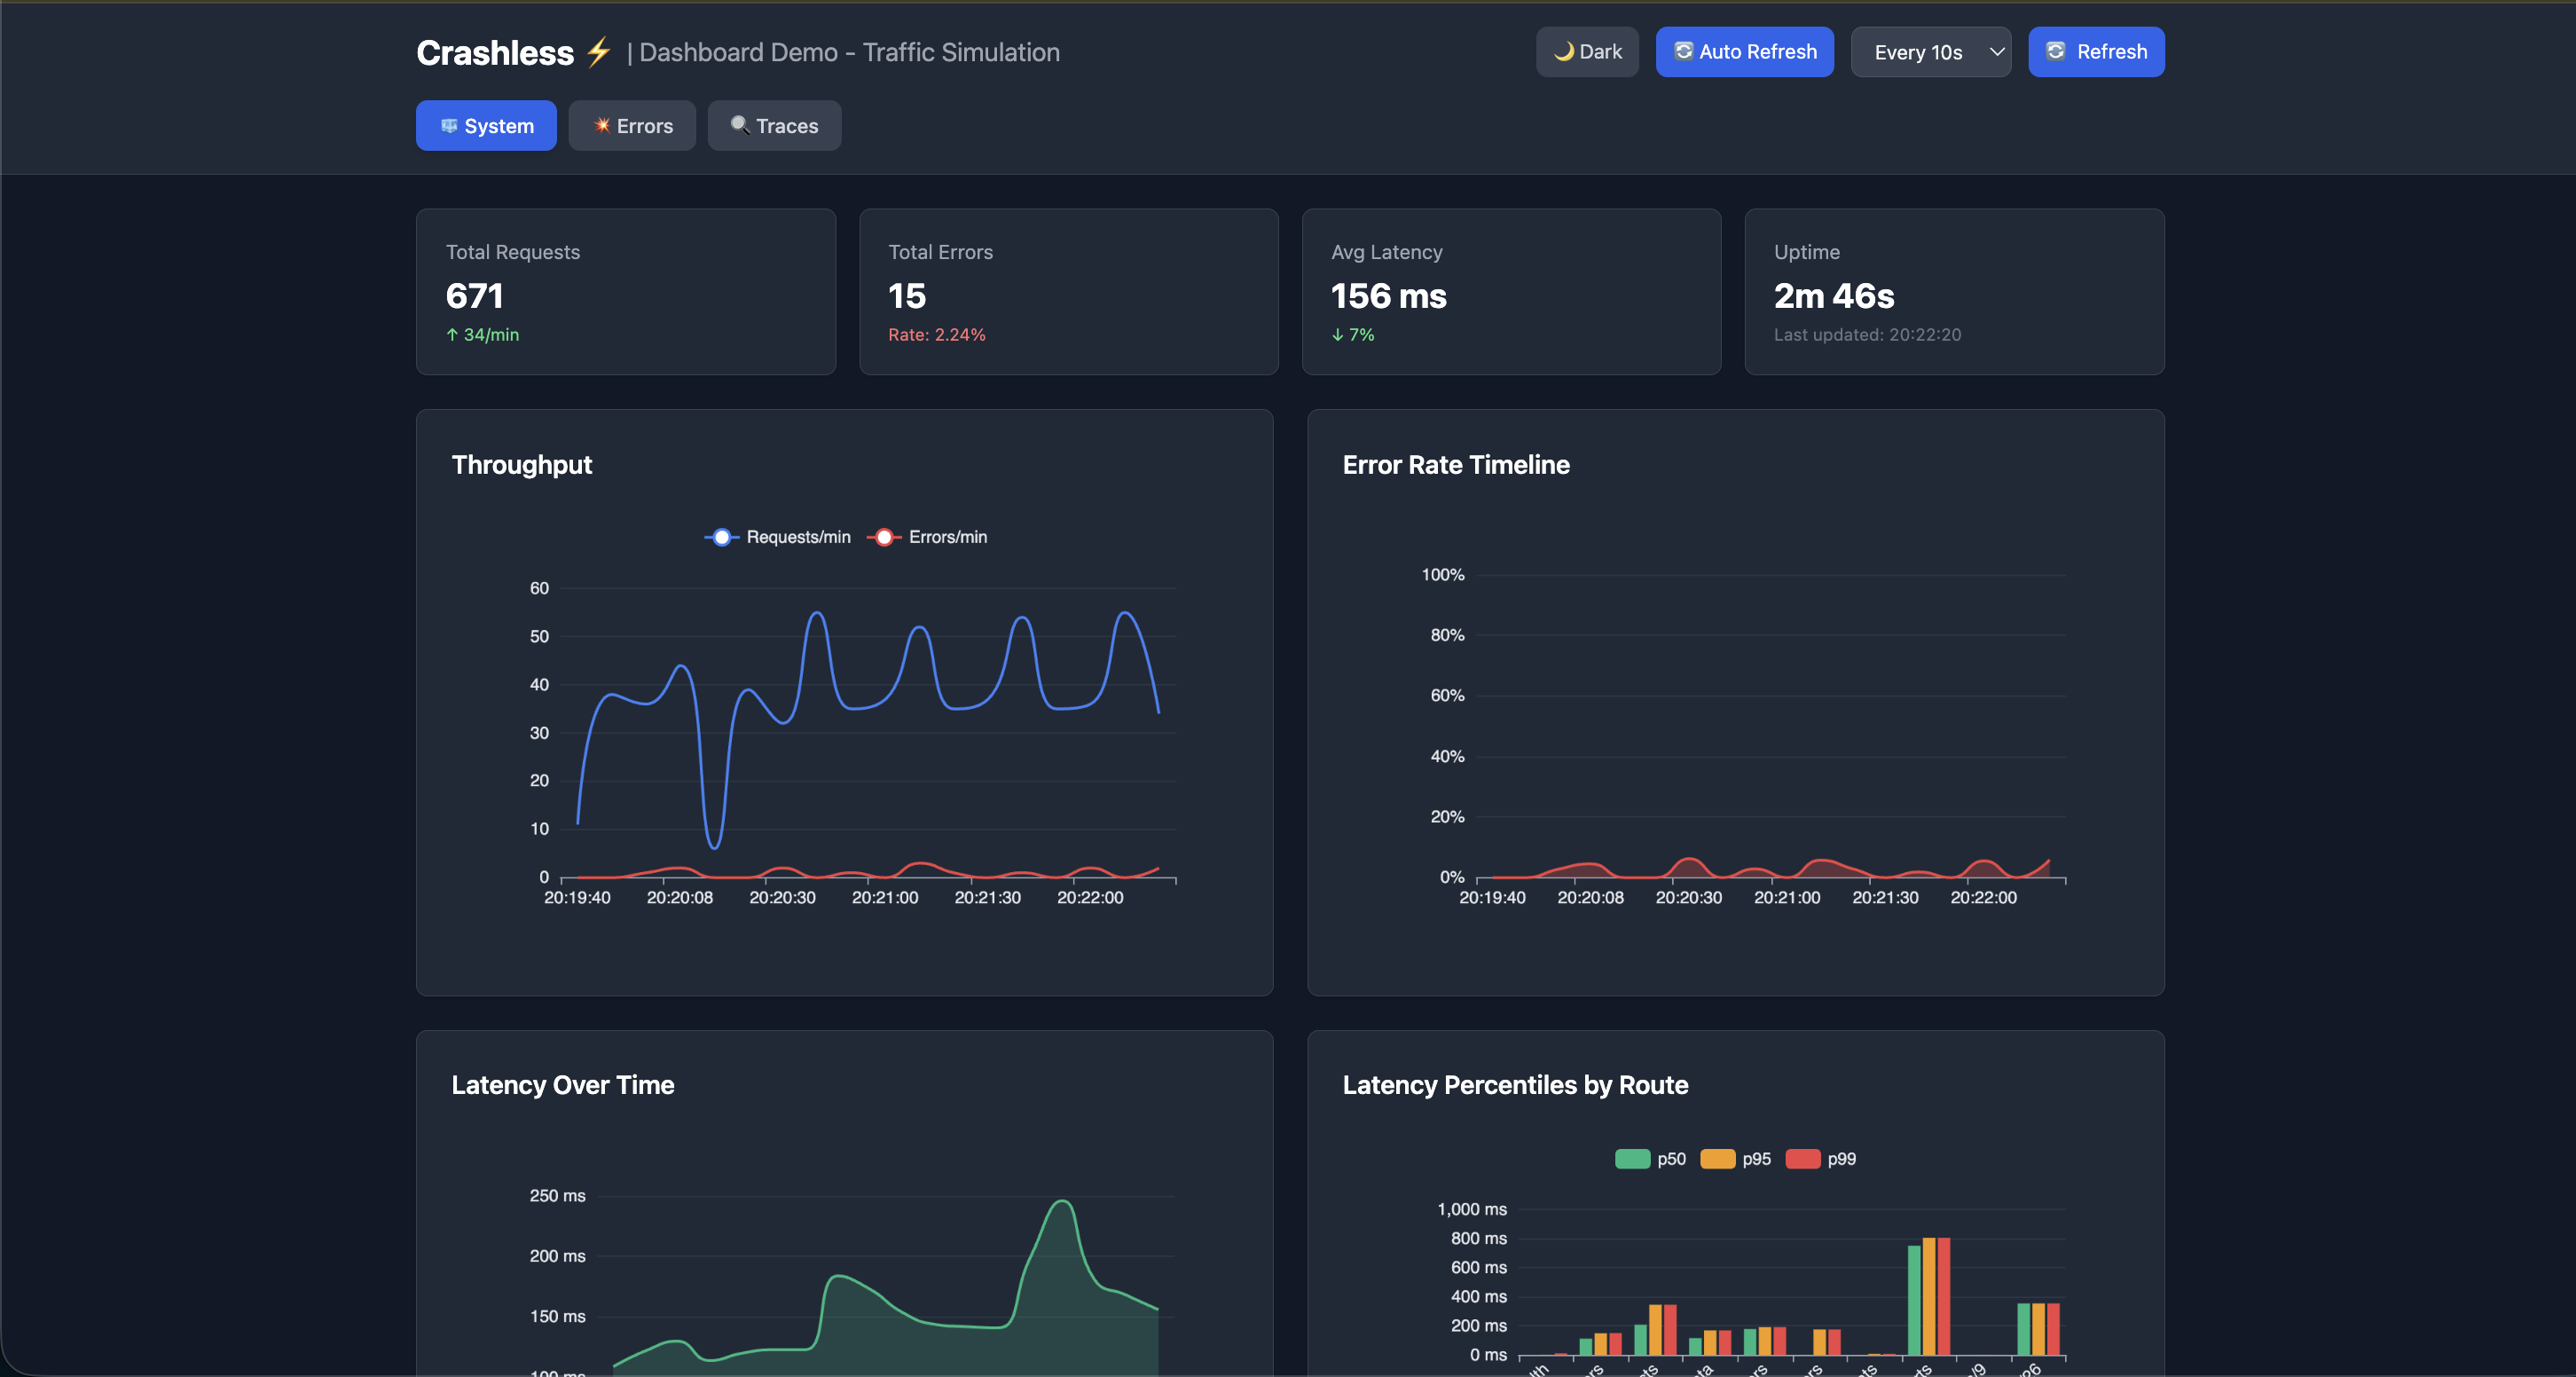
});Real-time observability dashboard with three powerful views:
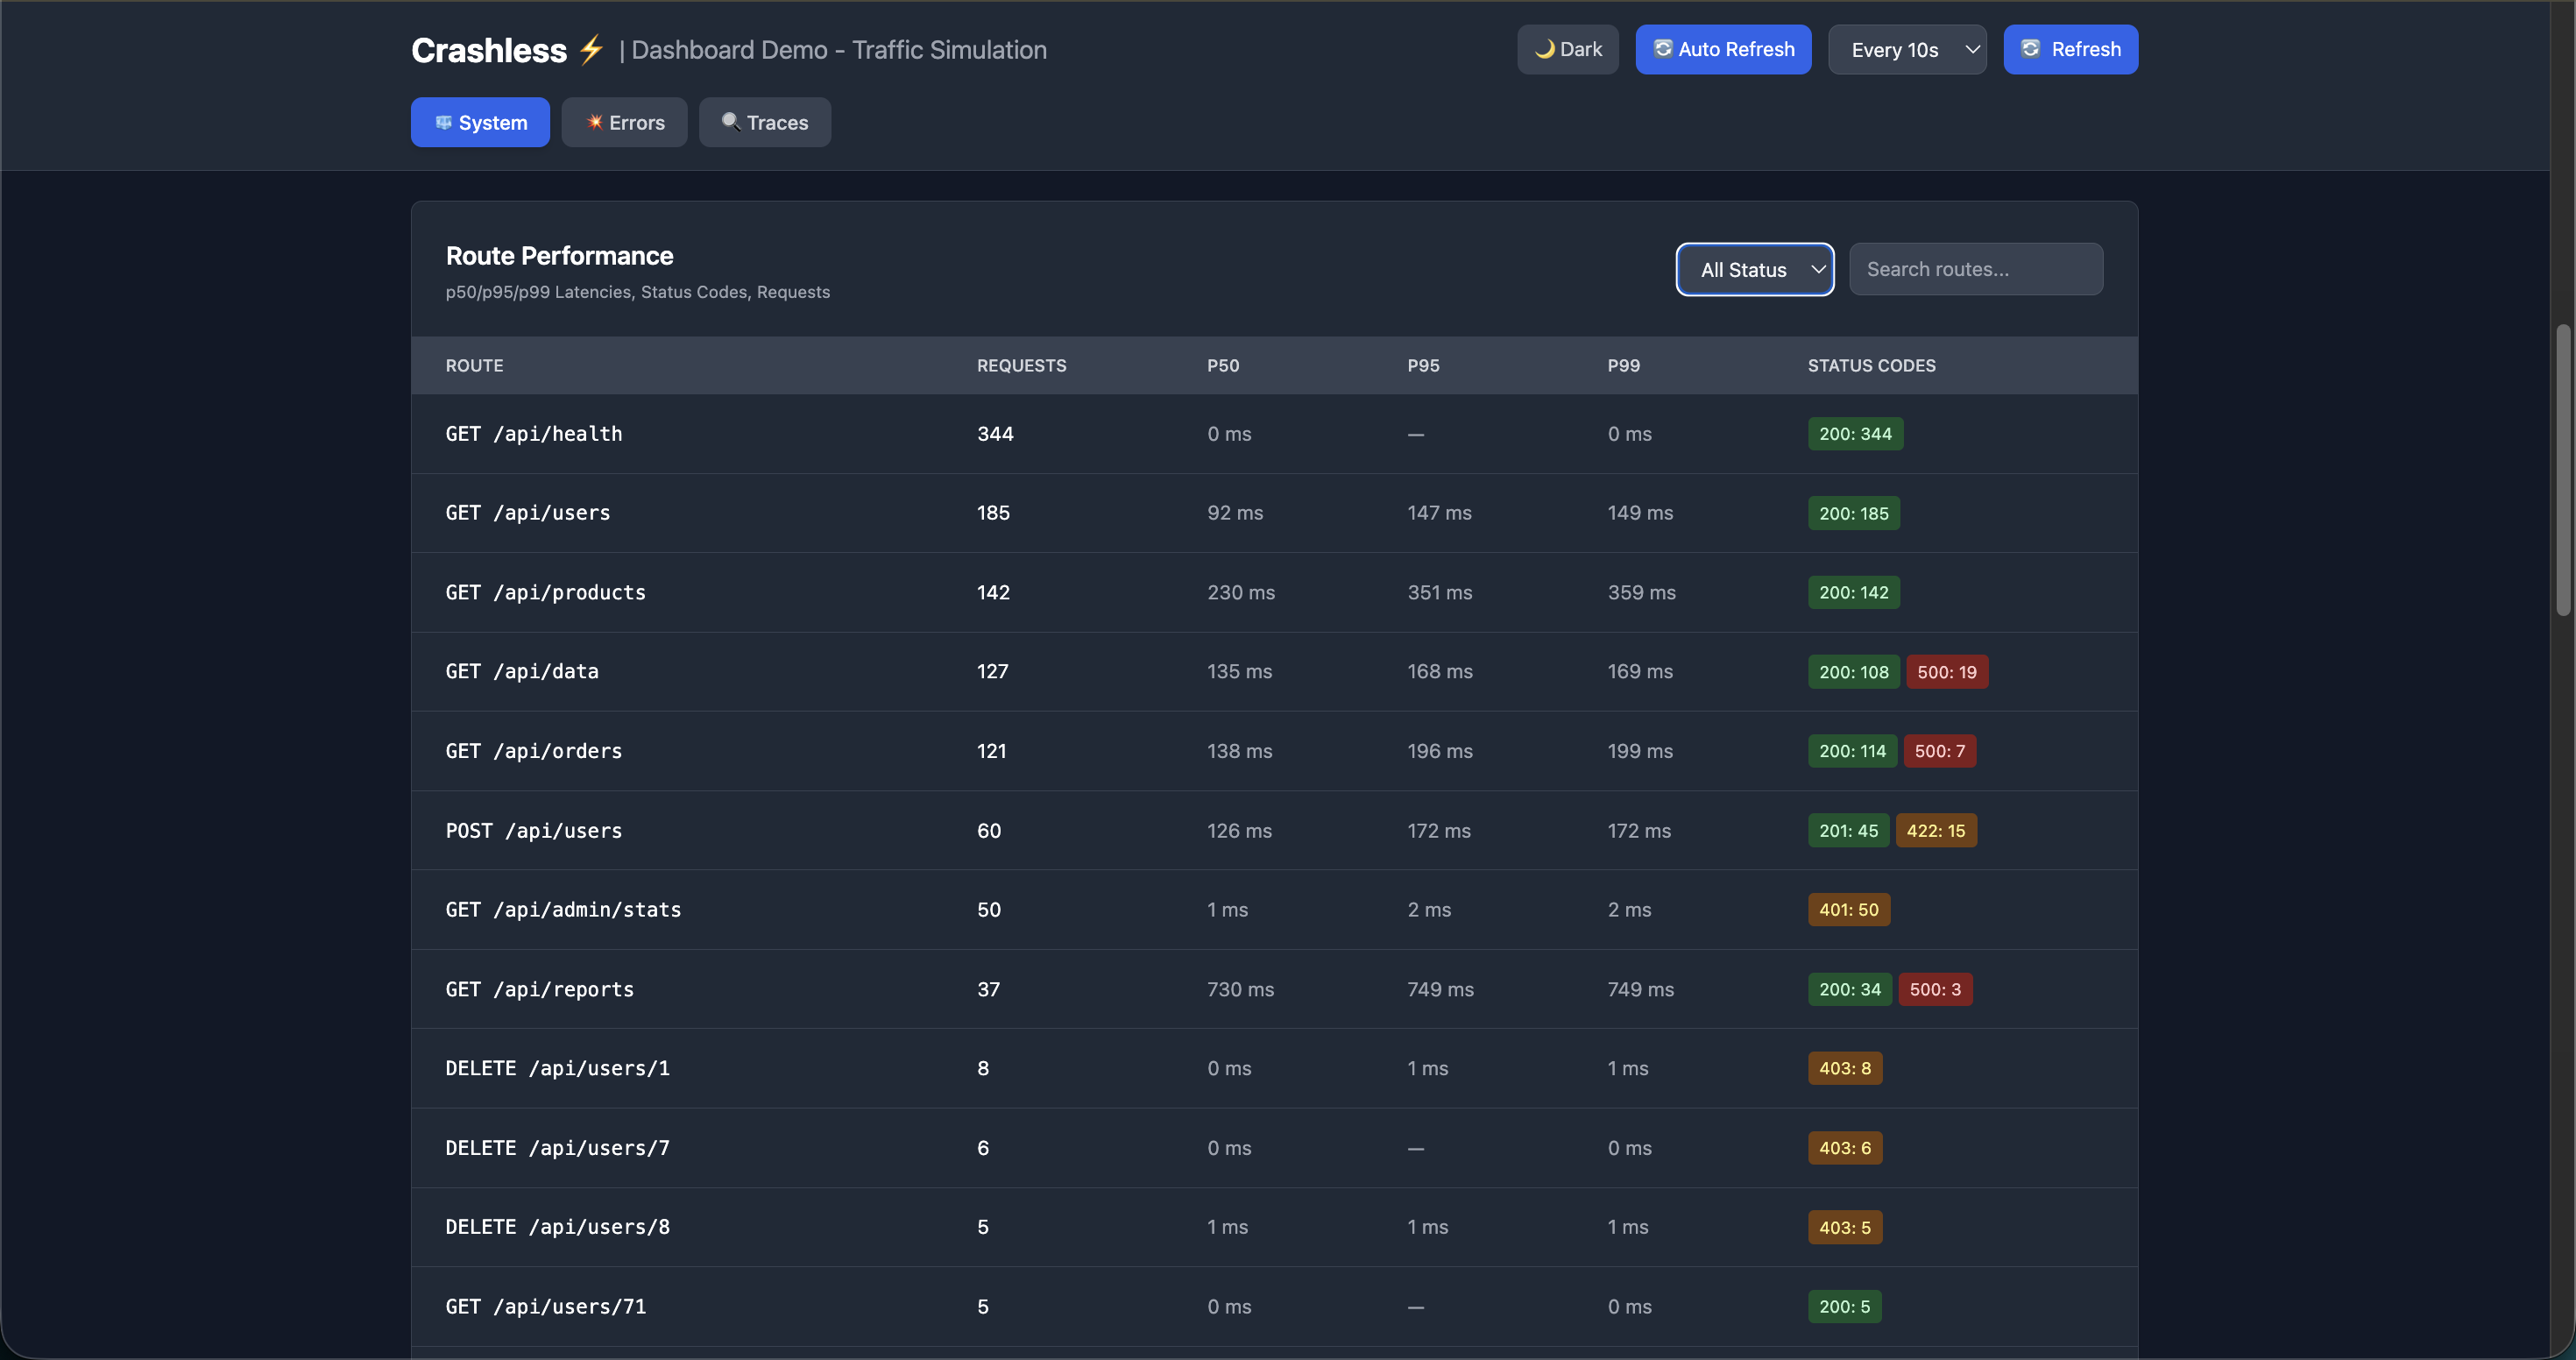
- System Dashboard - Request metrics, throughput, latency, route performance
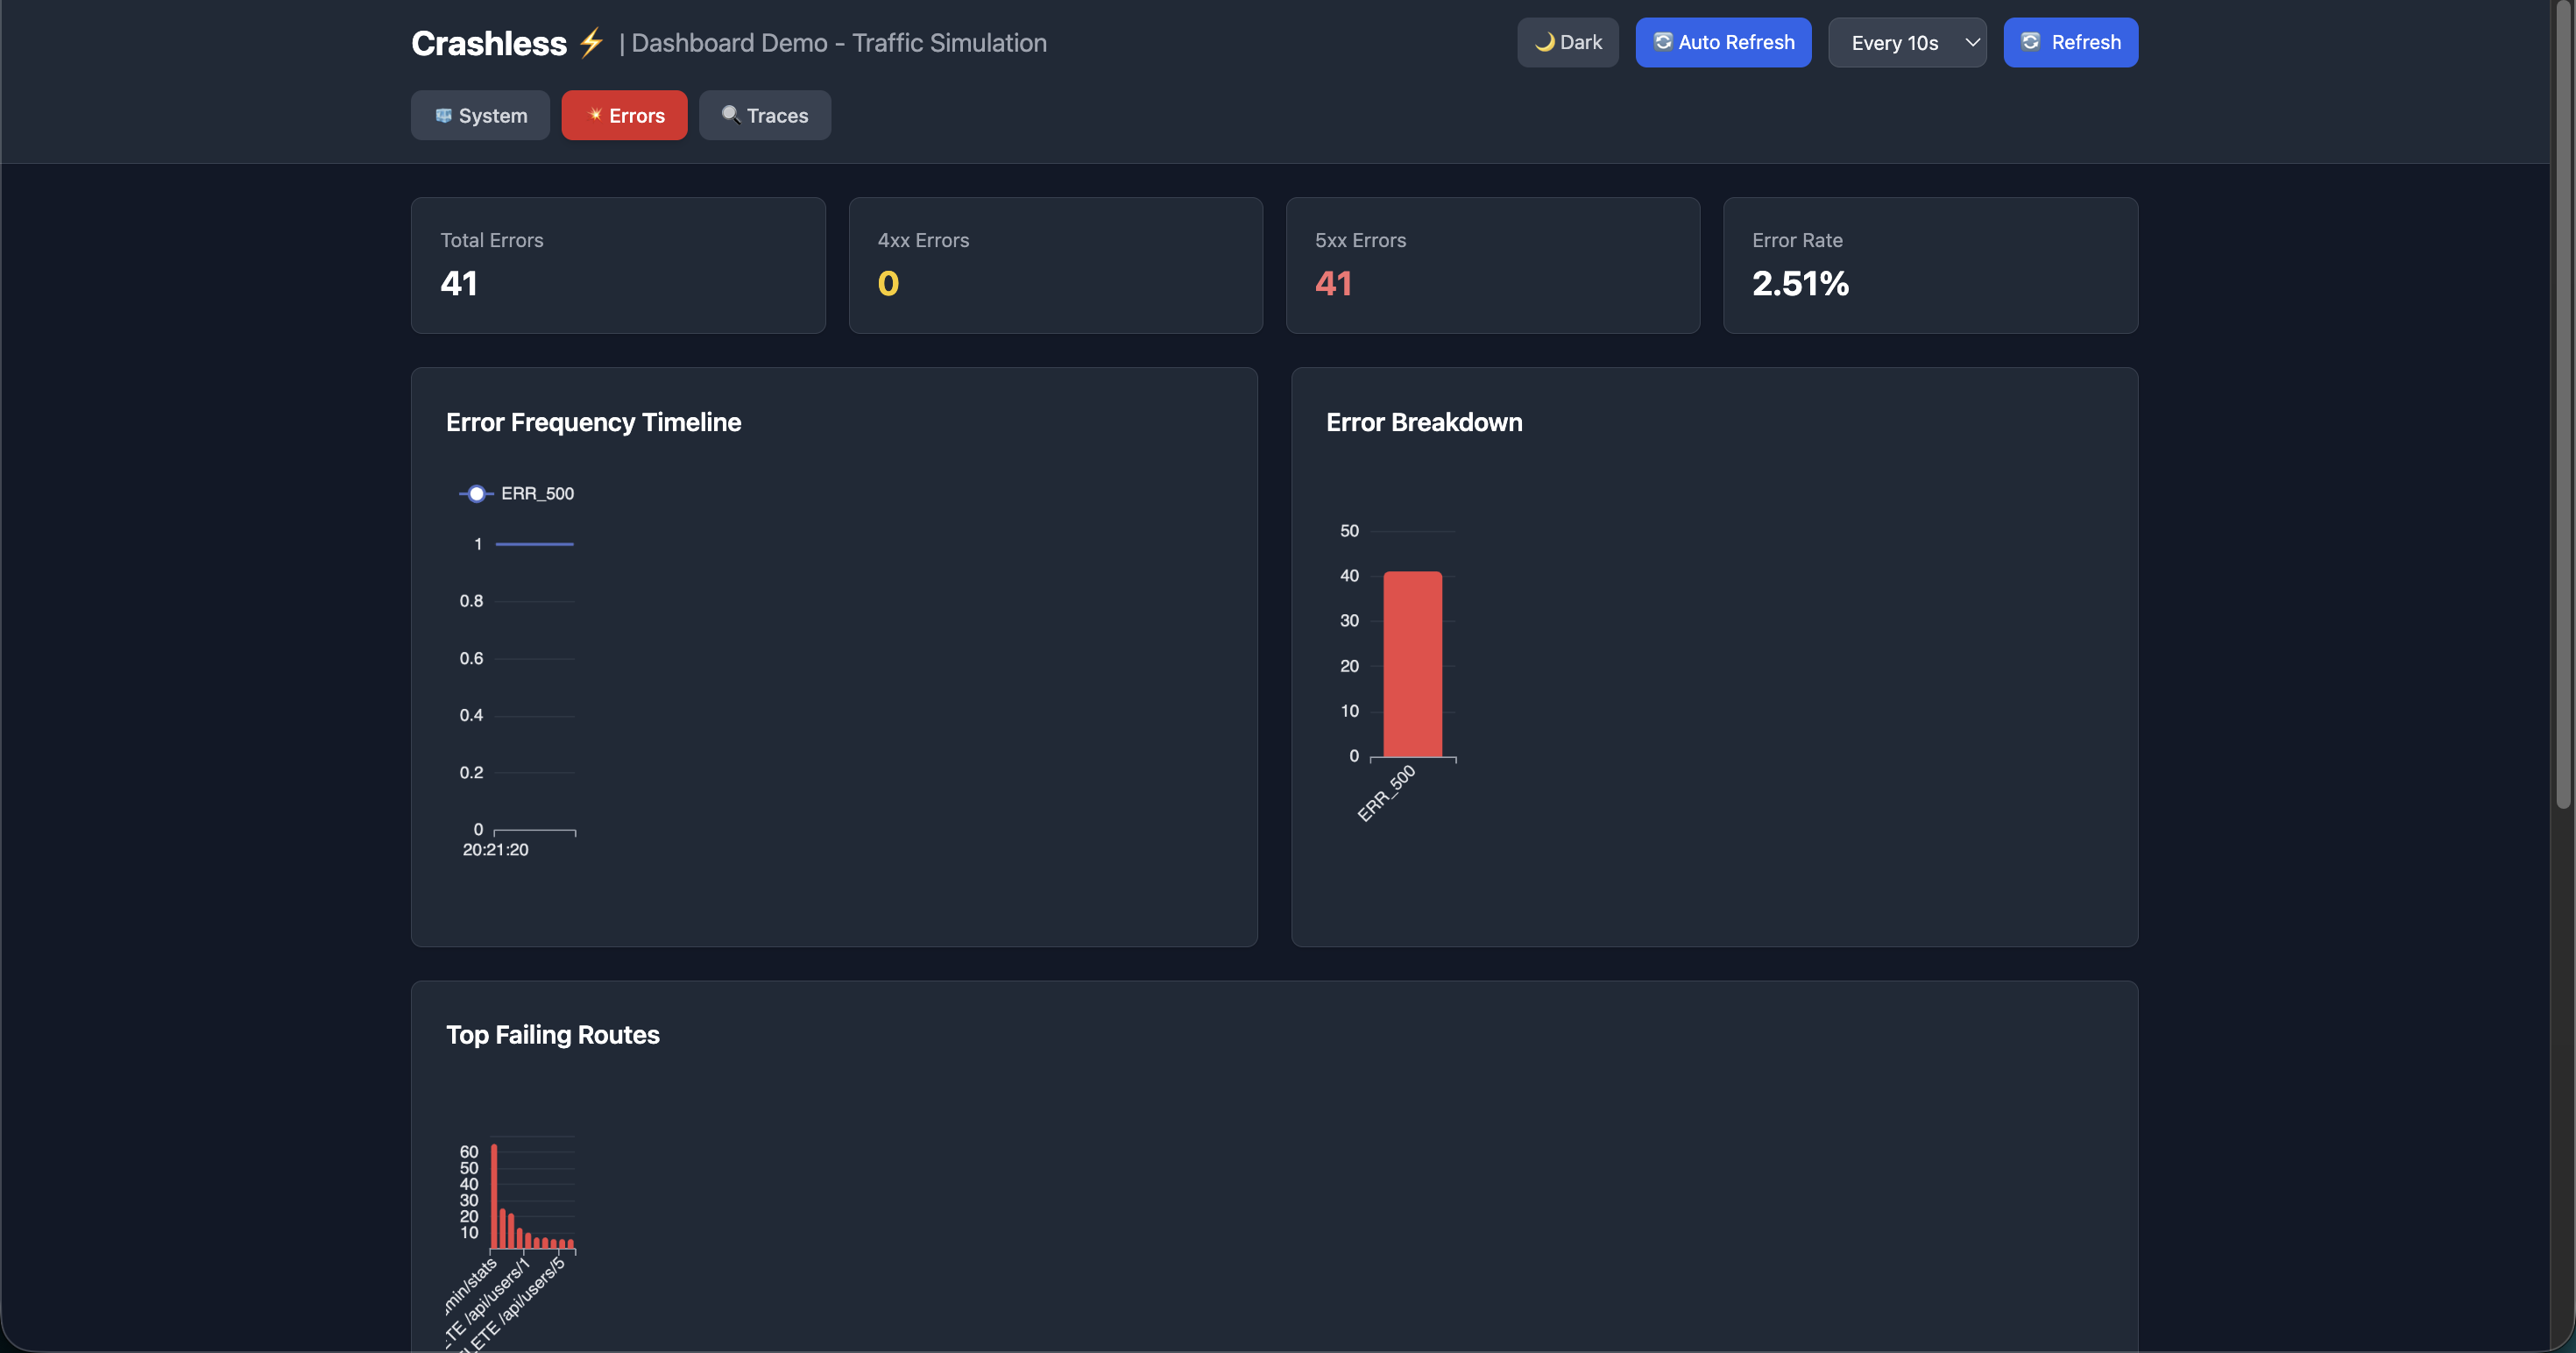
- Errors Dashboard - Error frequency, top failing routes, live error stream
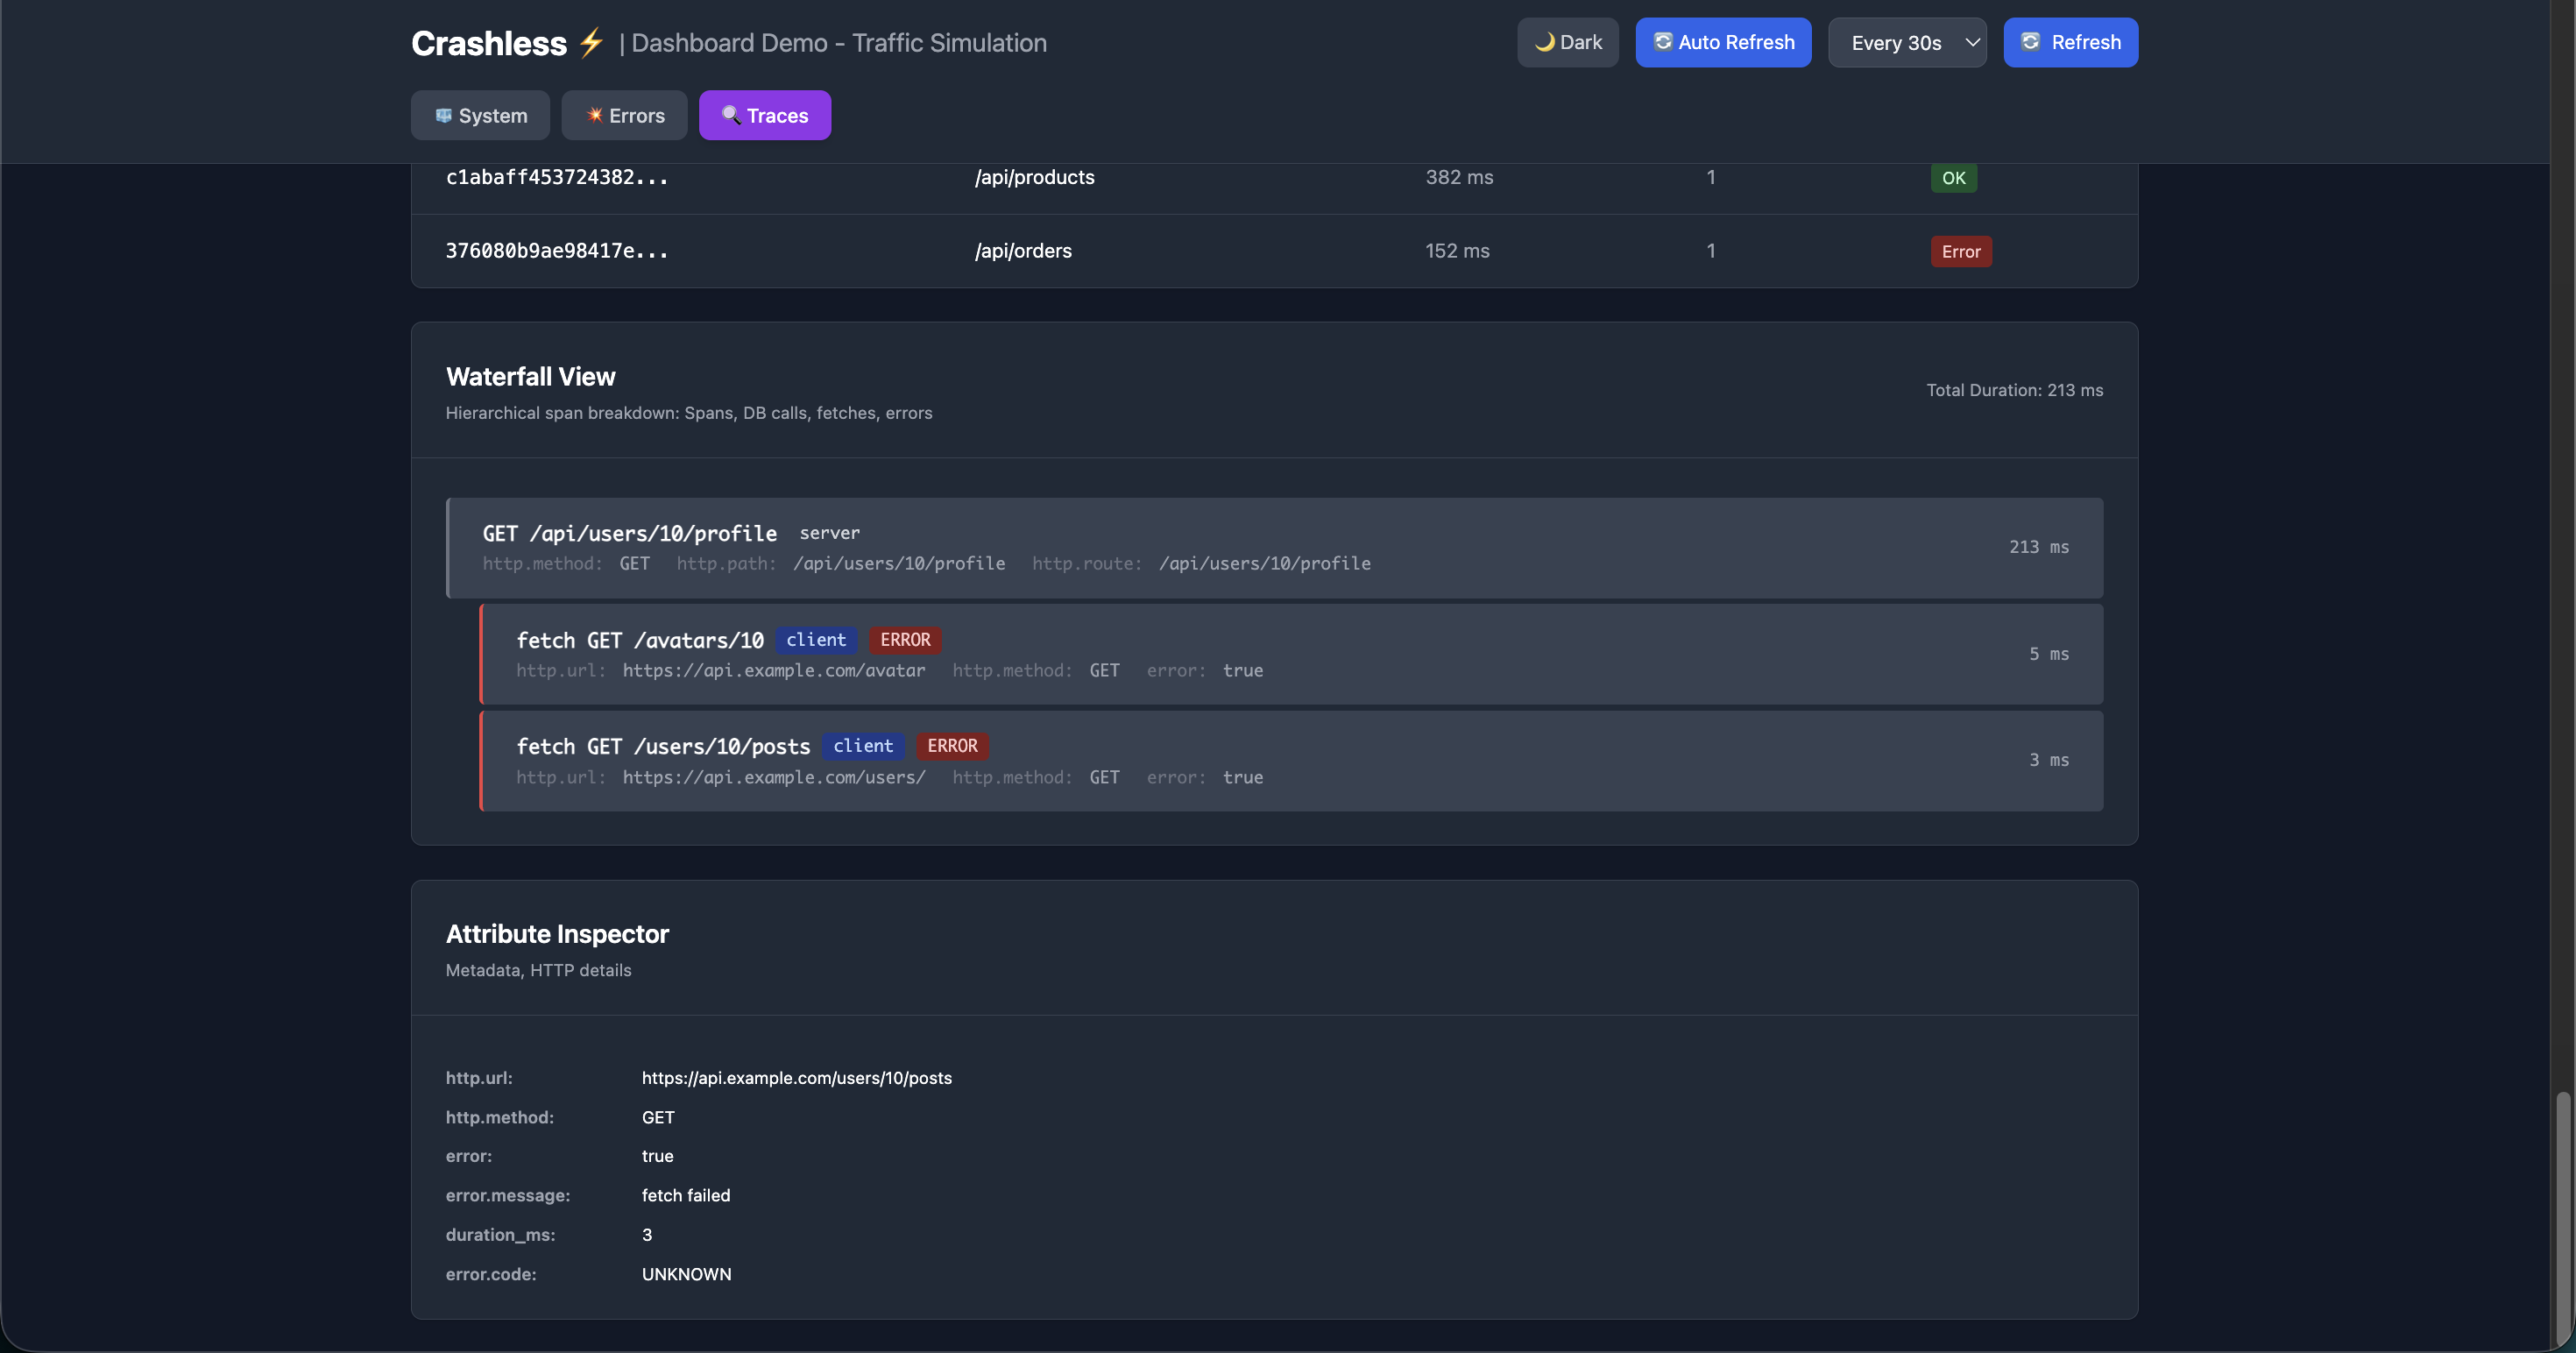
- Traces Dashboard - Request traces with waterfall visualization
Access: http://localhost:3000/_crashless
Automatic tracing for HTTP requests, fetch() calls, and fs.readFile() operations.
app.use(crashless({
  telemetry: {
    traces: {
      enabled: true,
      samplingRate: 0.2 // Sample 20% of requests
    }
  }
}));
Export traces: GET /traces.json?format=otlp - OpenTelemetry OTLP format
Full OpenTelemetry compatibility for metrics and traces.
app.use(crashless({
  telemetry: {
    engine: 'otel' // OpenTelemetry format
  }
}));
Endpoints:
GET /metrics/otel- OpenTelemetry metricsGET /traces.json?format=otlp- OTLP trace export
Prometheus-compatible metrics export for Grafana integration.
app.use(crashless({
  telemetry: {
    engine: 'prometheus'
  }
}));
Endpoint: GET /metrics - Prometheus format
Integrate with Sentry, Datadog, or any monitoring service.
app.use(crashless({
  exporters: [
    {
      name: 'sentry',
      onError: (error, metadata) => {
        Sentry.captureException(error, { extra: metadata });
      }
    },
    {
      name: 'datadog',
      onError: (error, metadata) => {
        datadogClient.sendError(error, metadata);
      }
    }
  ]
}));Uses only Node.js built-ins. No external npm dependencies.
- Sensitive data masked automatically
- IP whitelist & token authentication
- Dashboard disabled in production by default
- Configurable overhead (2-30%)
app.use(crashless({
  telemetry: { engine: 'none' }
}));
Overhead: ~3% | Use case: High-traffic apps needing only error handling
app.use(crashless({
  telemetry: { engine: 'builtin' }
}));
Overhead: ~20% | Use case: Standard production with metrics
app.use(crashless({
  telemetry: {
    engine: 'builtin',
    traces: { enabled: true, samplingRate: 0.2 }
  }
}));
Overhead: ~27% | Use case: Full observability with distributed tracing
app.use(crashless({
  telemetry: {
    engine: 'otel',
    traces: { enabled: true }
  }
}));
Use case: Integration with OTel collectors (Jaeger, Tempo, etc.)
app.use(crashless({
  telemetry: {
    engine: 'prometheus'
  }
}));
Use case: Prometheus scraping for Grafana dashboards
app.use(crashless({
  exporters: [
    {
      name: 'sentry',
      onError: (error, metadata) => Sentry.captureException(error)
    }
  ]
}));
Use case: Integration with existing monitoring tools
Verified benchmarks (Node.js v24.3.0, M3 Pro, 50 concurrent users):
| Configuration | Throughput (req/s) | Overhead |
|---|---|---|
| Plain Express | 15,761 | — |
| Crashless (minimal) | 15,406 | +2.3% |
| Crashless (+metrics) | 13,082 | +20.5% |
| Crashless (+traces 20%) | 12,390 | +27.2% |
| express-async-errors | 6,919 | +127.8% |
Key Insight: Crashless is ~2.2× faster than express-async-errors with full observability.
| Feature | Crashless | express-async-errors | APM Tools |
|---|---|---|---|
| Async error handling | ✅ | ✅ | |
| Server crash prevention | ✅ | ||
| Built-in dashboard | ✅ | ❌ | ✅ Remote |
| OpenTelemetry support | ✅ | ❌ | ✅ |
| Prometheus export | ✅ | ❌ | ✅ |
| Custom exporters | ✅ | ❌ | |
| Distributed tracing | ✅ | ❌ | ✅ |
| Zero dependencies | ✅ | ❌ | ❌ |
| Local metrics | ✅ | ❌ | |
| Free & open source | ✅ | ✅ | ❌ |
| Avg overhead | ~3-27% | ~130% | ~40-70% |
// ❌ WITHOUT CRASHLESS - Server crashes
app.get('/users/:id', async (req, res) => {
  const user = await db.getUser(req.params.id); // 💥 Unhandled rejection = crash
  res.json(user);
});// ✅ WITH CRASHLESS - Server stays alive
app.use(crashless());
app.get('/users/:id', async (req, res) => {
const user = await db.getUser(req.params.id); // 🛡️ Caught & logged
res.json(user);
});- 🛡️ Automatic error handling - Never crash from unhandled errors
- 📊 Built-in dashboard - Real-time metrics, errors, and traces
- 🔍 Distributed tracing - See exactly what happens in every request
- 📈 OpenTelemetry - Full OTel compatibility
- 📊 Prometheus - Native Prometheus export
- 🔌 Custom exporters - Integrate with any monitoring tool
- 🔐 Production-safe - Sensitive data masked automatically
- ⚡ Zero npm dependencies - Uses only Node.js built-ins
- 📦 npm Package
- 📚 Documentation
- 💻 GitHub Repository
- 🎮 Examples Repository
- 🖼️ Screenshots
- 🐛 Issues
- 💬 Discussions
MIT © Sunny Ghodeswar
Production-ready observability without the complexity.