Analyzing Annotations
Once you collect the annotations, factgenie can help you with computing basic statistics over the annotation labels:

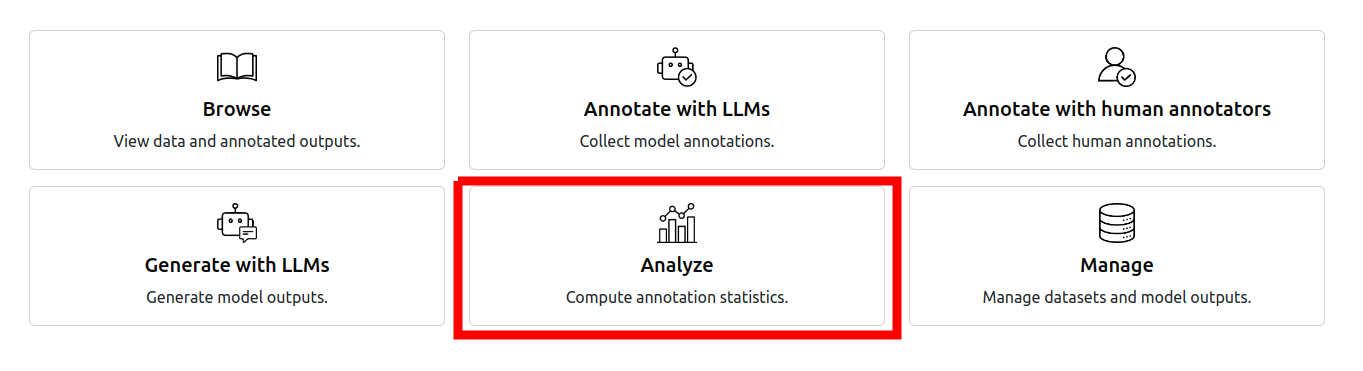
You can find the tools for the analysis at /analyze:
On the Analysis page, there are two main interfaces:
- Individual statistics,
- Inter-annotator agreement.
This interface provides statistics about a single annotation campaign.
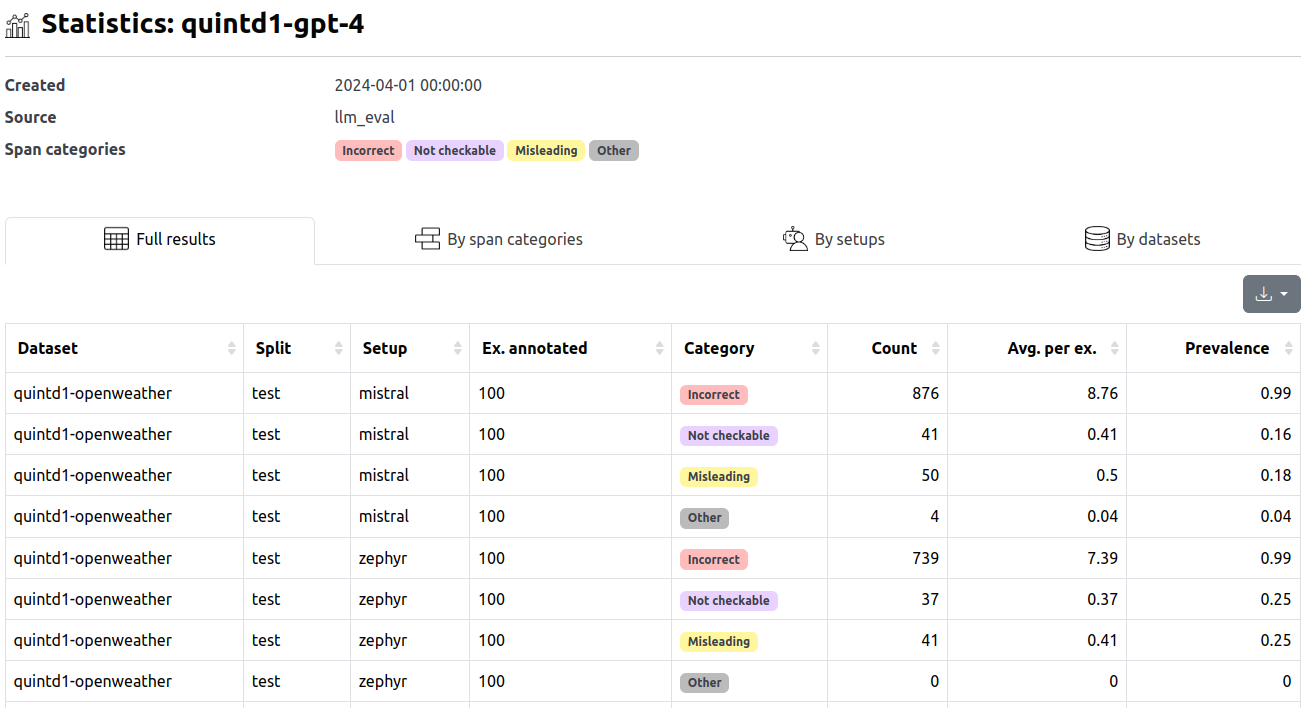
In the table, we can find the following columns:
- Dataset, split, setup: The source of the corresponding inputs (see terminology).
- Category: The annotation span category label.
- Ex. annotated: The number of examples annotated within the campaign.
- Count: The total number of label occurences within annotated examples.
- Avg. per ex.: The average number of label occurences within annotated examples (=Count / Ex. annotated).
- Prevalence: A ratio of outputs containing the label (0 to 1 range).
The statistics are provided in full detail and also grouped by various aspects (label categories, setups, datasets).
Note that the page with individual statistics for each campaign can be also opened using the "View statistics" button on the campaign detail page.

This interface provides a way to compute inter-annotator agreement among span labels in pairs of campaigns:
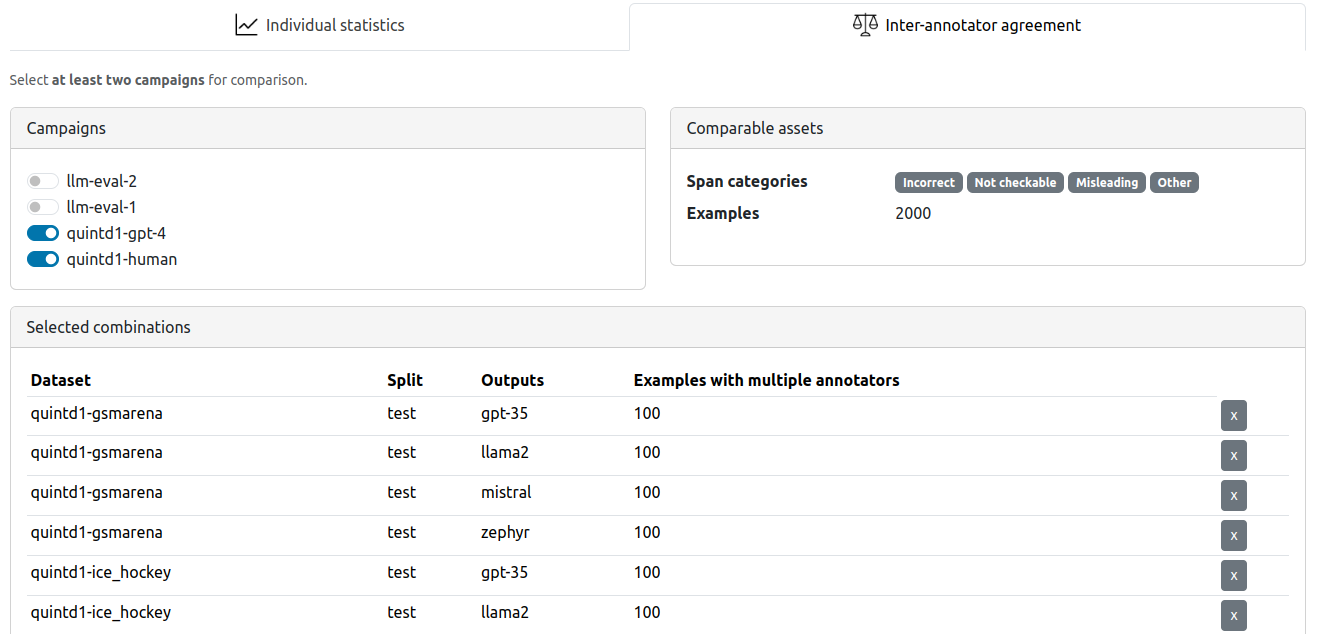
To provide you better control over the results, we do not compute the inter-annotator agreement (IAA) directly in factgenie.
Instead, the process is the following:
- Select here the campaign(s) you want to compute IAA for.
- Download the files with pre-computed data for the selected campaigns.
- Use a tool of your choice to compute the IAA yourself.
For your convenience, we provide a 👉️ Jupyter notebook 👈️ showing how you can compute the Pearson r coefficient (dataset-level and example-level error count correlations) along with the γ (Gamma) score (fine-grained score based on span alignment) using the files exported from factgenie.