A Python-based Matplotlib extension module for implementing axis breaks (visual gaps) and multi-interval custom scaling functions, suitable for displaying data with large value ranges or irrelevant intermediate intervals.
Matplotlib natively does not support axis breaks (visual gaps) and flexible multi-interval scaling. This module fills this gap with a series of easy-to-use functions, including:
- Drawing break markers on axis edges to indicate data gaps
- Clipping axis spines, lines, and plot elements to hide unwanted intervals
- Supporting linear/logarithmic custom scaling for multiple data intervals
-
Install from PyPI
pip install break_axes
-
Build the binary distribution package (wheel) locally
First install thebuildtool:pip install build, then run:python -m build
This generates a
.whlbinary package in thedist/directory (faster installation). -
Install the package locally (development mode)
Use this for development and real-time debugging, allowing code changes without reinstalling:pip install -e .
Generally, users only need to use the two functions scale_axes and
broken_and_clip_axes.
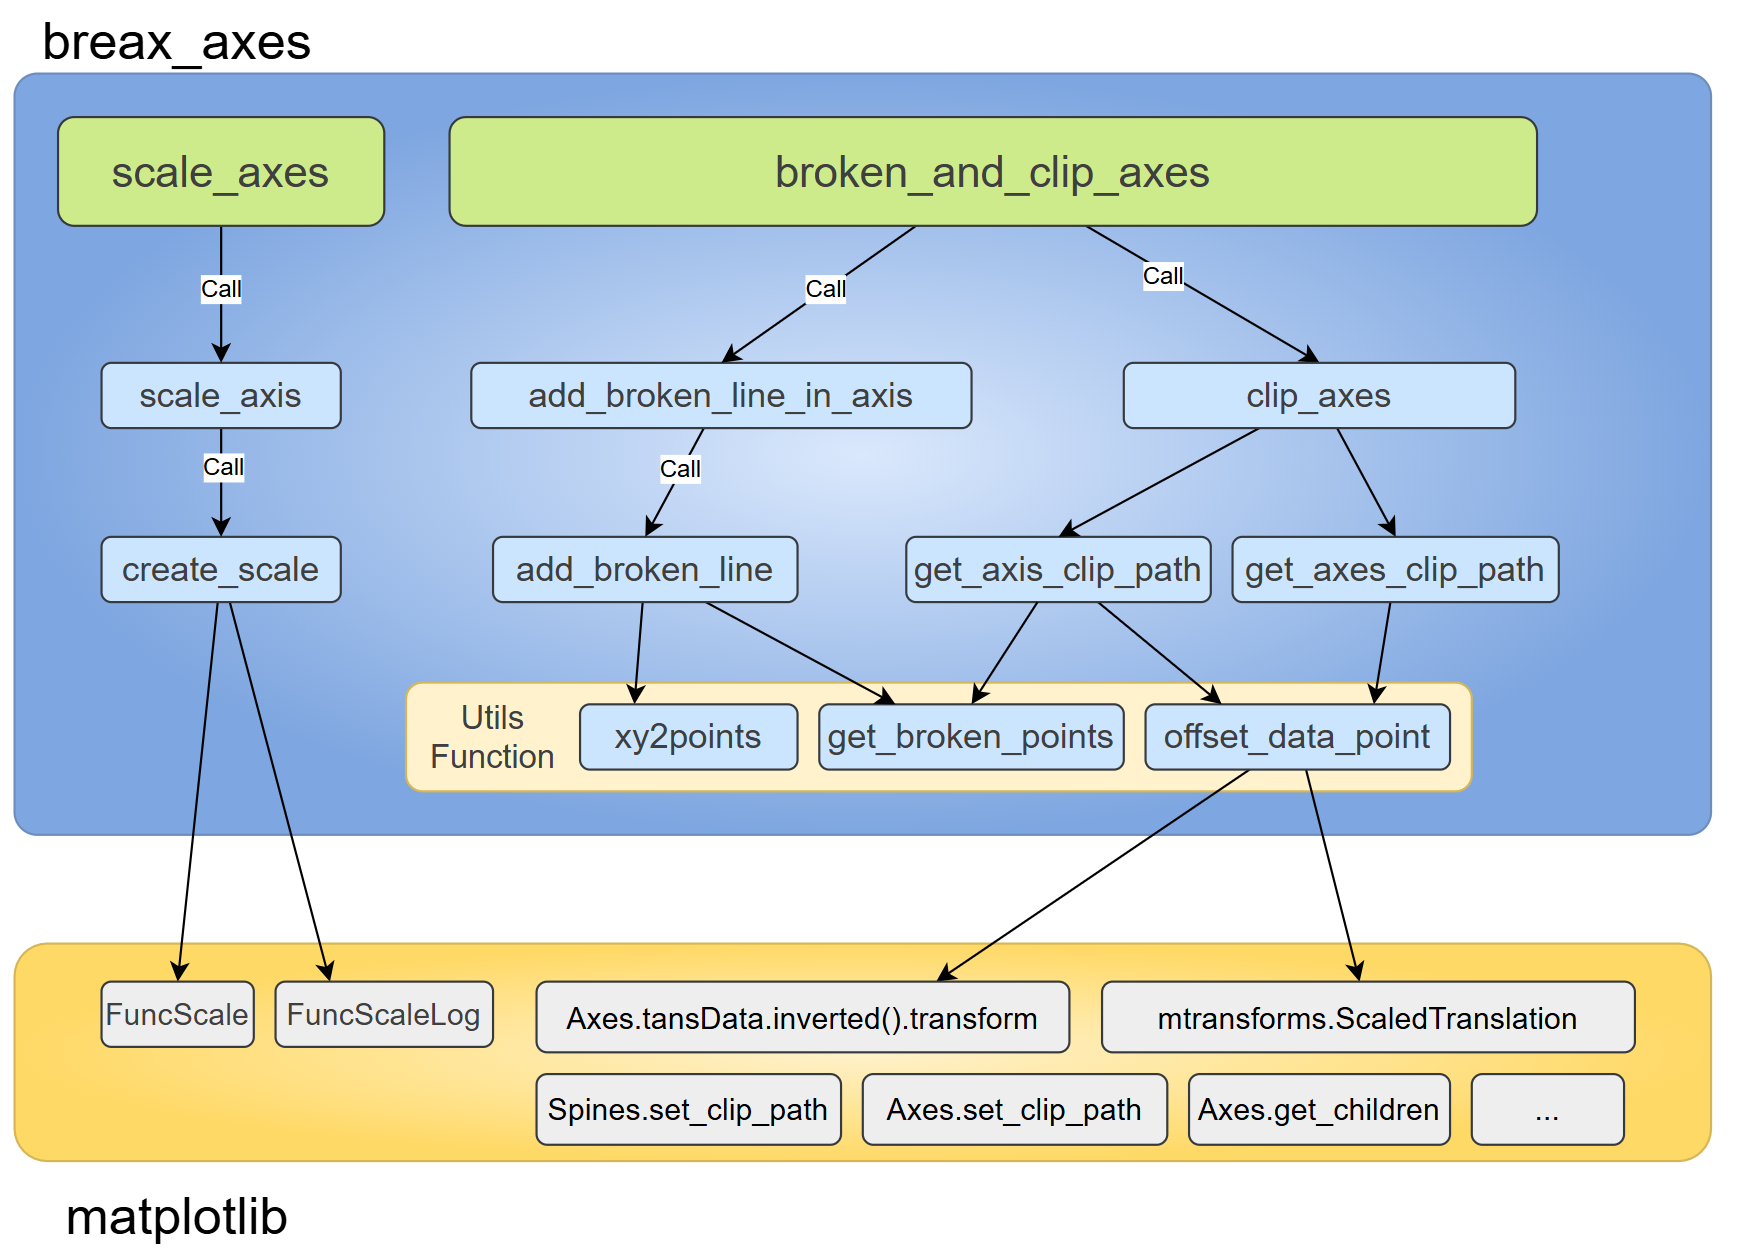
However, for more flexible break settings, you may need to read the source code (less than 900 lines, about half of which are docstrings).
| Function Name | Description |
|---|---|
create_scale |
Used to generate a ScaleBase object for scaled axes |
scale_axis |
A wrapper function for create_scale, used to directly apply scaling |
scale_axes |
Used to apply axis scaling in batches, supporting simultaneous scaling of x-axis and y-axis |
offset_data_point |
Get the vertex coordinates of the break identifier corresponding to the specified break point |
get_broken_points |
Get the vertex coordinates of the marker end points |
xy2points |
Combine input x, y coordinates into data point coordinates |
add_broken_line |
Add break markers at specified positions |
add_broken_line_in_axis |
Add break markers on the axis |
get_axis_clip_path |
Get the clipping path of the specified axis for clipping axis spines |
get_axes_clip_path |
Get the clipping path of the axes for clipping artists within the axes |
clip_axes |
Clip spines and artists |
broken_and_clip_axes |
Wrapper for add_broken_line_in_axis and clip_axes |
- Python 3.8 or higher
- Matplotlib 3.5.0 or higher
Installation command:pip install matplotlib
import matplotlib.pyplot as plt

from break_axes import __version__, scale_axes, broken_and_clip_axes

plt.rcParams['figure.figsize'] = (3,3)
plt.rcParams['figure.dpi'] = 200
plt.rcParams['axes.linewidth'] = 1.5

print(f"break_axes version: {__version__}")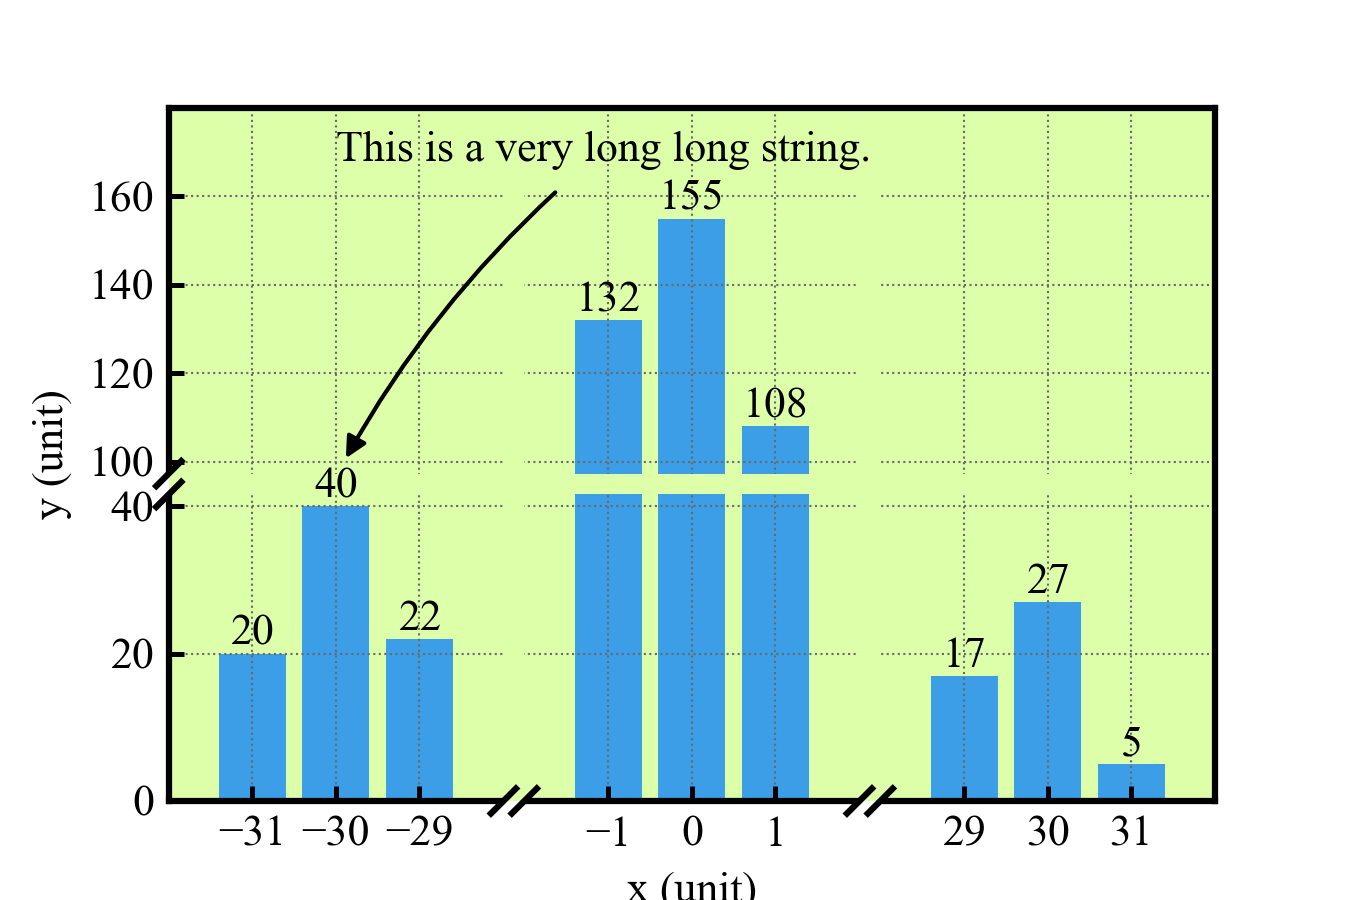
fig, ax = plt.subplots(figsize=(4.5,3))
ax.set(xlim=(-32,32), ylim=(0,180), xlabel="x (unit)", ylabel="y (unit)")
ax.set_facecolor("#DDFFAA")
ax.grid(ls=':', lw=0.5, color='dimgray')

# scale x-axis and y-axis to reduce the blank space
scale_axes(ax,
           x_interval=[(-28, -2, 0.01), (2, 28, 0.01)],
           y_interval=[(40,100, 0.1), (100, 180, 0.6)],
           mode="linear")


_ = ax.set_xticks([-31,-30,-29,-1,0,1,29,30,31])
_ = ax.set_yticks([0,20, 40, 100, 120, 140,160])

rects = ax.bar([-31,-30,-29,-1,0,1,31,30,29], [20,40,22,132,155,108,5,27,17] )
ax.bar_label(rects)

# Text and Annotation wont be clipped
ax.annotate("This is a very long long string.", xy=(-30, 80), xytext=(-30, 168),
    arrowprops=dict(
        arrowstyle='-|>',
        connectionstyle="arc3,rad=0.1",
        color='k',
        shrinkA=5, shrinkB=5
    )
)

# Add broken line in x-axis and y-axis, clip spines and artists in axes
broken_and_clip_axes(ax, x=[-15,15], y=[70], axes_clip=True, which='lower',
                     gap=5, dx=3, dy=3)

# plt.savefig("break_axes_bar.png", transparent=False)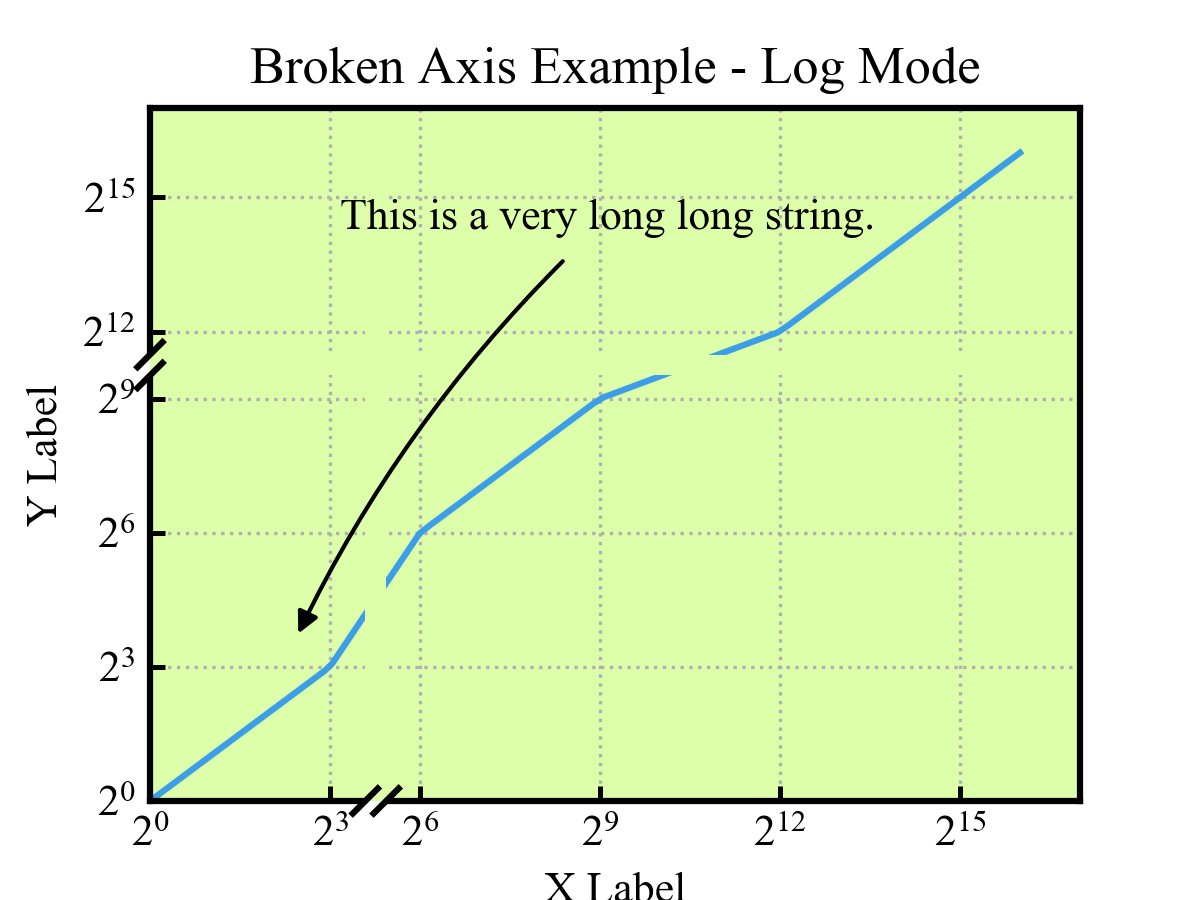
import numpy as np

x = np.logspace(0, 16, 100, base=2)

fig, ax = plt.subplots(figsize=(4,3))
ax.set(xlim=(1, 2<<16), ylim=(1, 2<<16), facecolor="#DDFFAA")
ax.plot(x, x)
ax.set_xticks([ 2<<i for i in range(0,17,3)])
# ax.set_yticks([1, 10, 100, 500, 5000, 10000],
#               [1, 10, 100, 500, 5000, r'$10^4$'])  # type: ignore

ax.annotate("This is a very long long string.",
    xy=(5, 10), xytext=(10, 20000),
    arrowprops=dict(
        arrowstyle='-|>',
        connectionstyle="arc3,rad=0.1",
        color='k',
        shrinkA=5, shrinkB=5
    )
)

ax.grid(ls=':')
ax.set_xlabel("X Label")
ax.set_ylabel("Y Label")
ax.set_title("Broken Axis Example - Log Mode")

scale_axes(ax,
    x_interval=[(3, 6, 0.5)],
    y_interval=[(9, 12, 0.5)],
    mode='log', base_x=2, base_y=2)
broken_and_clip_axes(ax, x=[23], y=[1450],
    axes_clip=True, which='lower', gap=5, dx=3, dy=3)

plt.show()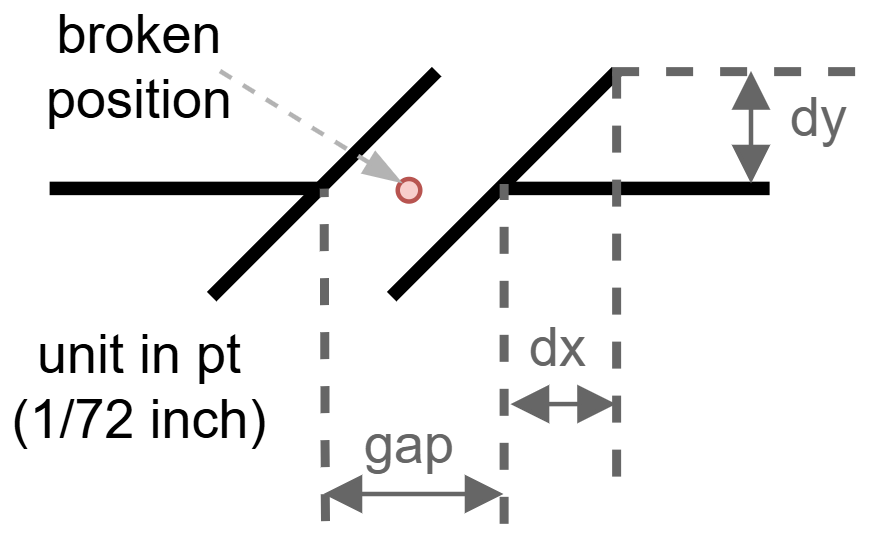
import numpy as np
x = np.logspace(-2, 4, 150)
fig, ax = plt.subplots(figsize=(4,3))
ax.set(xlim=(1,10000), ylim=(1,10000), facecolor="#DDFFAA")
ax.plot(x, x)
ax.set_xticks([0.01, 0.1, 1, 10, 100, 500, 5000, 10000])
ax.set_yticks([0.01, 0.1, 1, 10, 100, 500, 5000, 10000])
ax.annotate("This is a very long long string.",
xy=(5, 10), xytext=(10, 5000),
arrowprops=dict(
arrowstyle='-|>',
connectionstyle="arc3,rad=0.1",
color='k',
shrinkA=5, shrinkB=5
)
)
ax.grid(ls=':')
ax.set_xlabel("X Label")
ax.set_ylabel("Y Label")
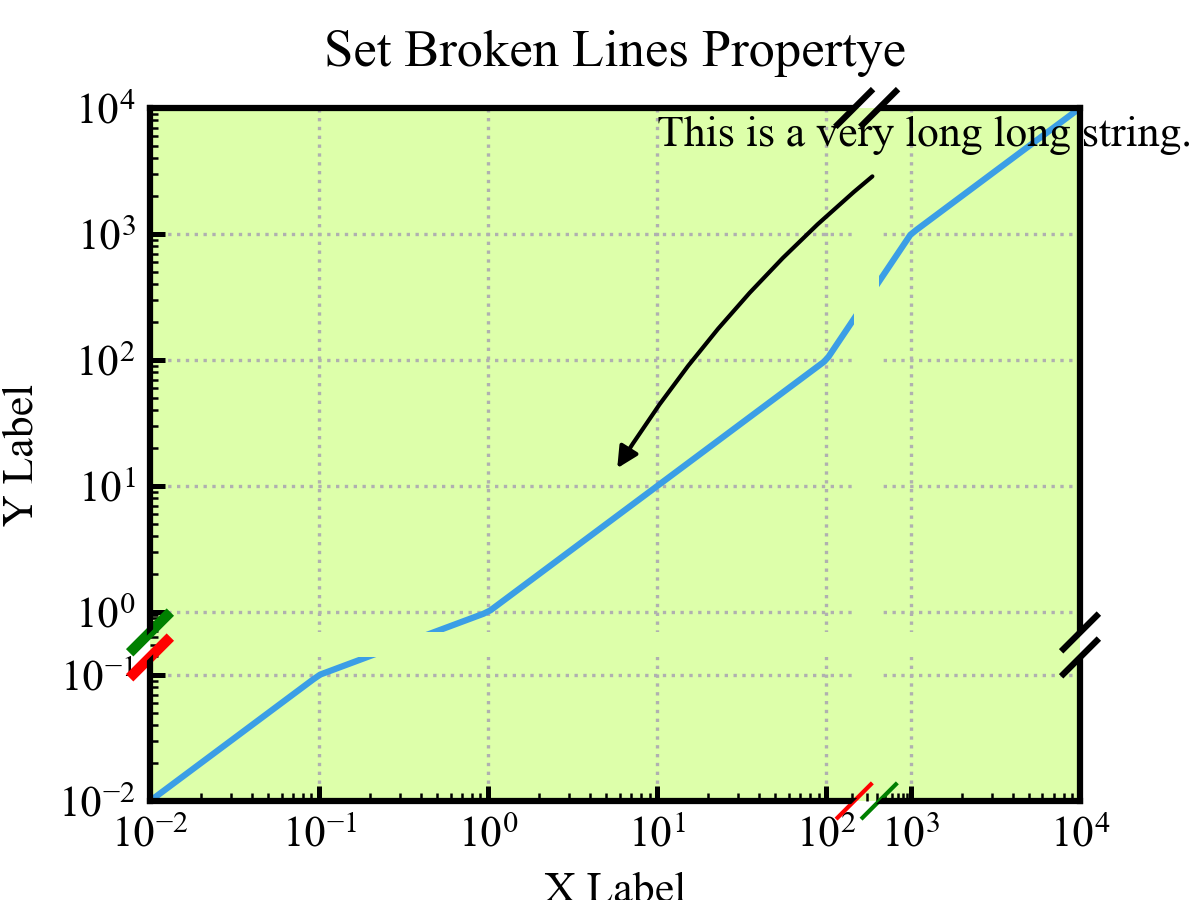
ax.set_title("Set Broken Lines Propertye", pad=10)
scale_axes(ax,
x_interval=[(2, 3, 0.5)],
y_interval=[(-1, 0, 0.5)],
mode='log')
broken_lines = broken_and_clip_axes(ax, x=[300], y=[0.3],
axes_clip=True, which='both', gap=6, dx=4, dy=4)
bottom_left, bottom_right = broken_lines["bottom"][0]
bottom_left.set(color='r', linewidth=1)
bottom_right.set(color='g', linewidth=1)
left_bottom, left_top = broken_lines["left"][0]
left_bottom.set(color='r', linewidth=2.5)
left_top.set(color='g', linewidth=2.5)
plt.show()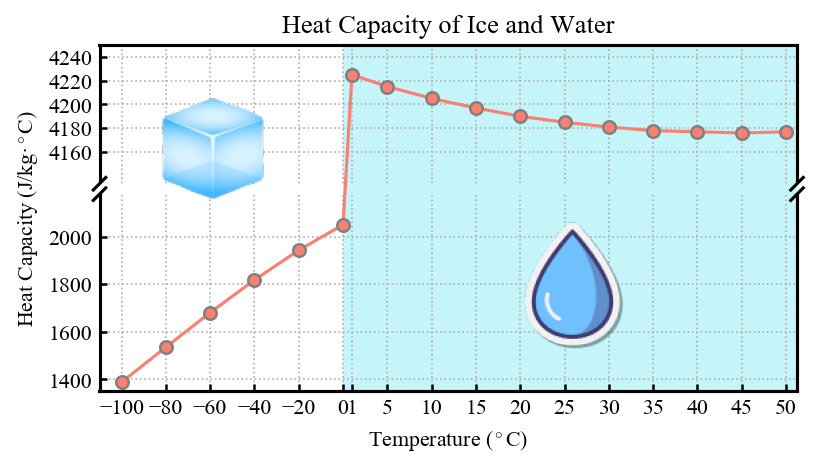
Code to see the example: heat_capacity_of_ice_and_water.ipynb
- Fix axis ranges first: Before calling the break/clip functions, you must fix the axis ranges using
ax.set_xlim()orax.set_ylim()— this is crucial to ensure accurate calculation of break positions. - Interval rules: When using
scale_axes, intervals must be non-overlapping and in order (e.g.,[(0,2,2), (5,10,1)]is valid,[(5,10,1), (0,2,2)]is invalid). - Clipping exclusions: Text elements (such as labels, tick values) and the axis background (
ax.patch) will not be clipped to avoid affecting readability. Users can also useget_axes_clip_pathto obtain the axis clipping path and manually add artists that need to be clipped with reference to theclip_axesfunction.
- Version: 0.2.0
- Author: Wu Yao wuyao1997@qq.com