Note: For the screenshots, you can store all of your answer images in the answer-img directory.
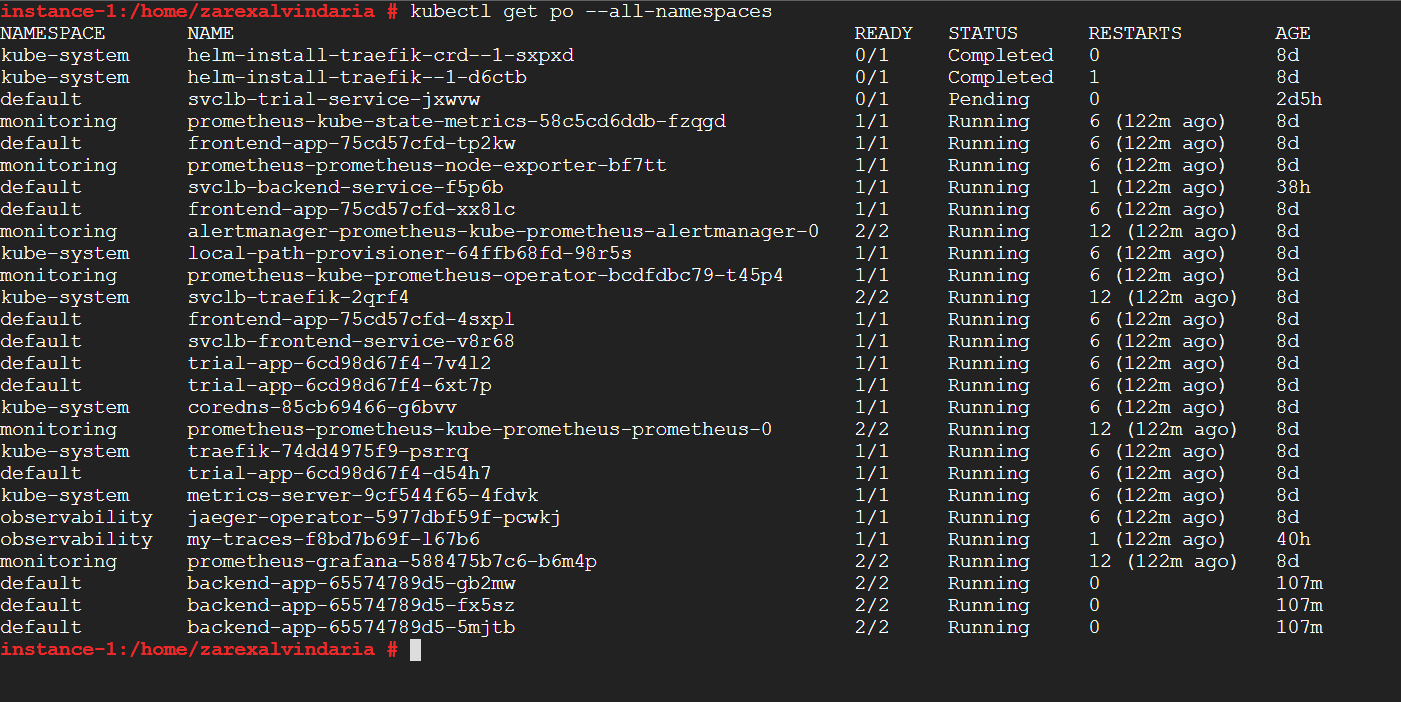
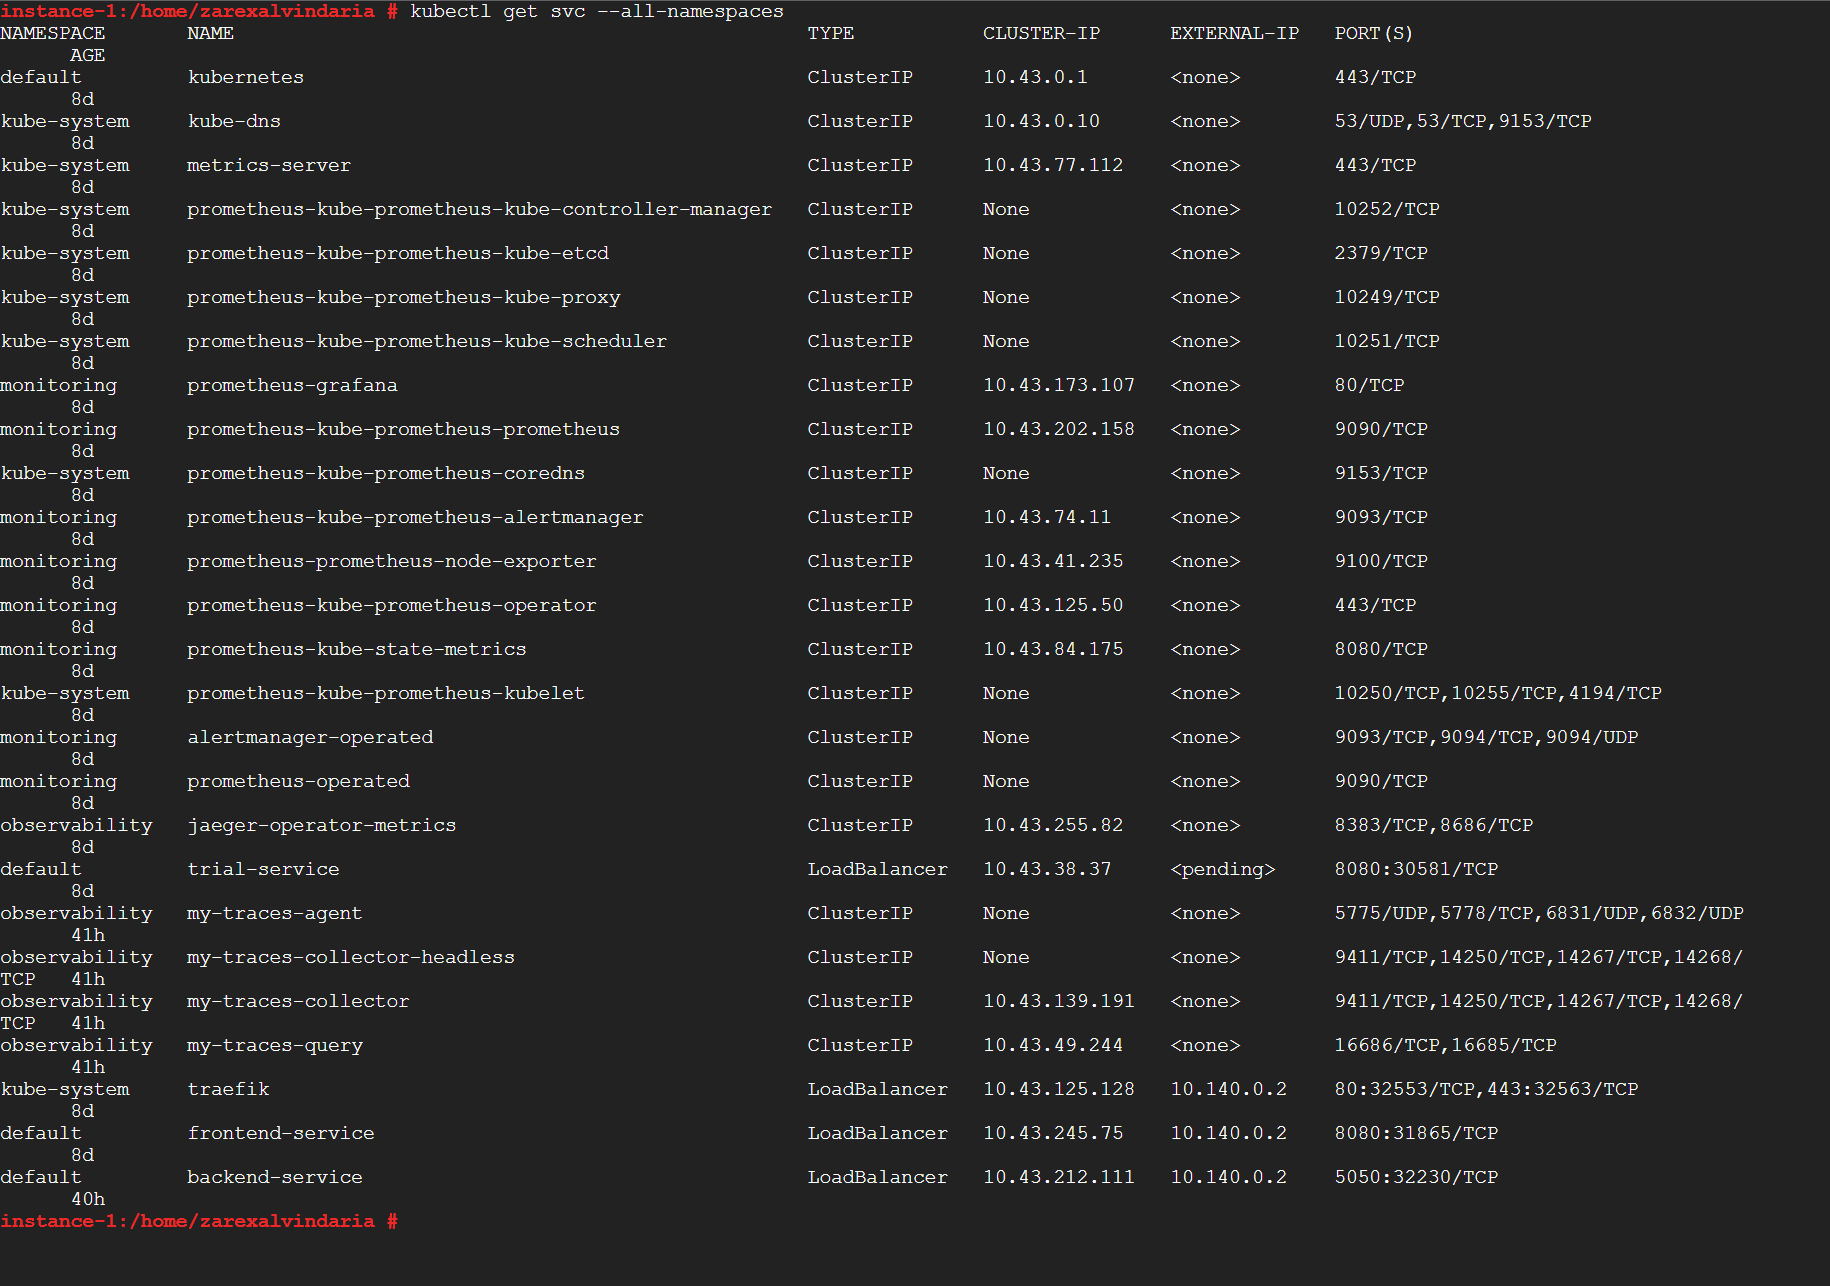
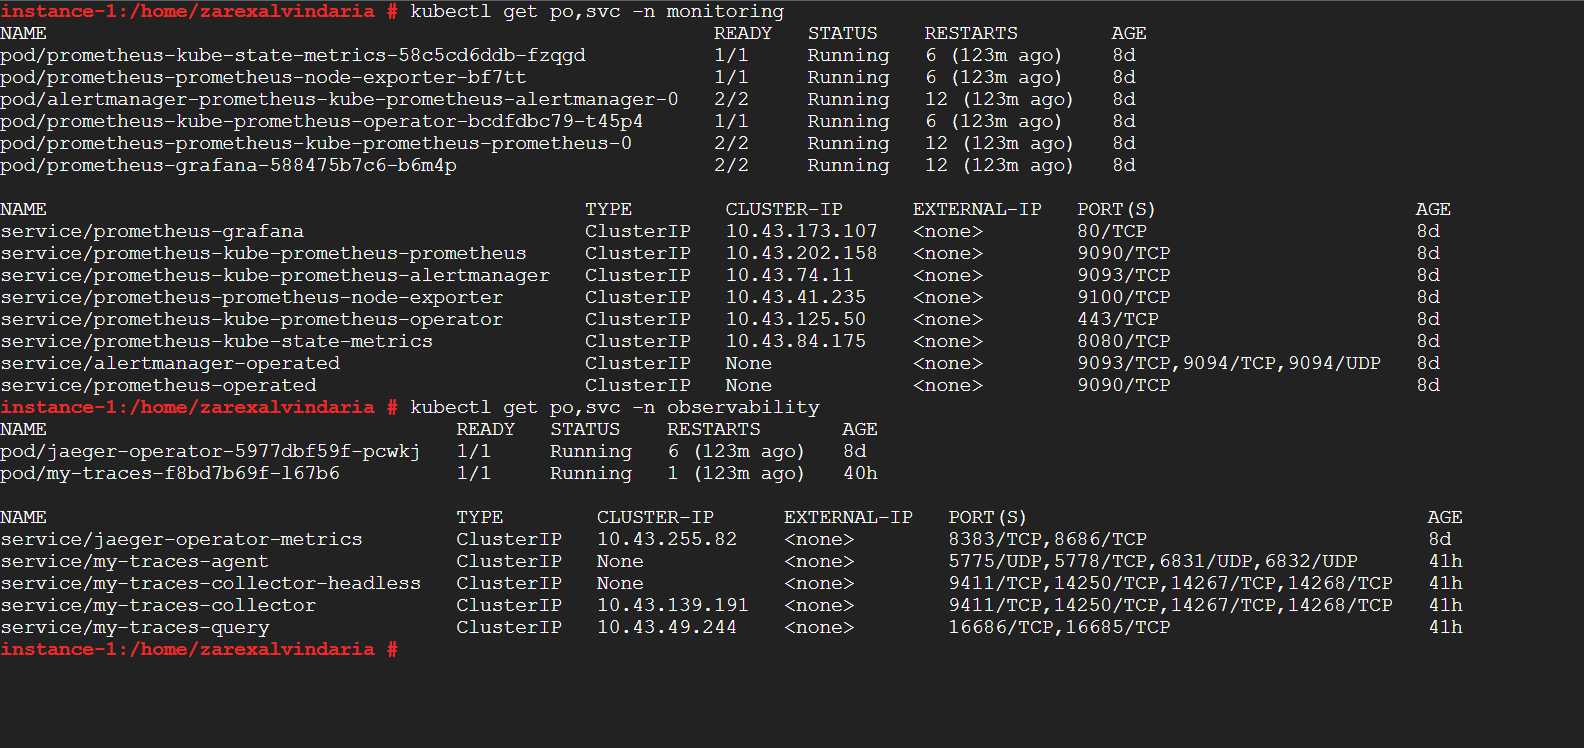
TODO: run kubectl command to show the running pods and services for all components. Take a screenshot of the output and include it here to verify the installation
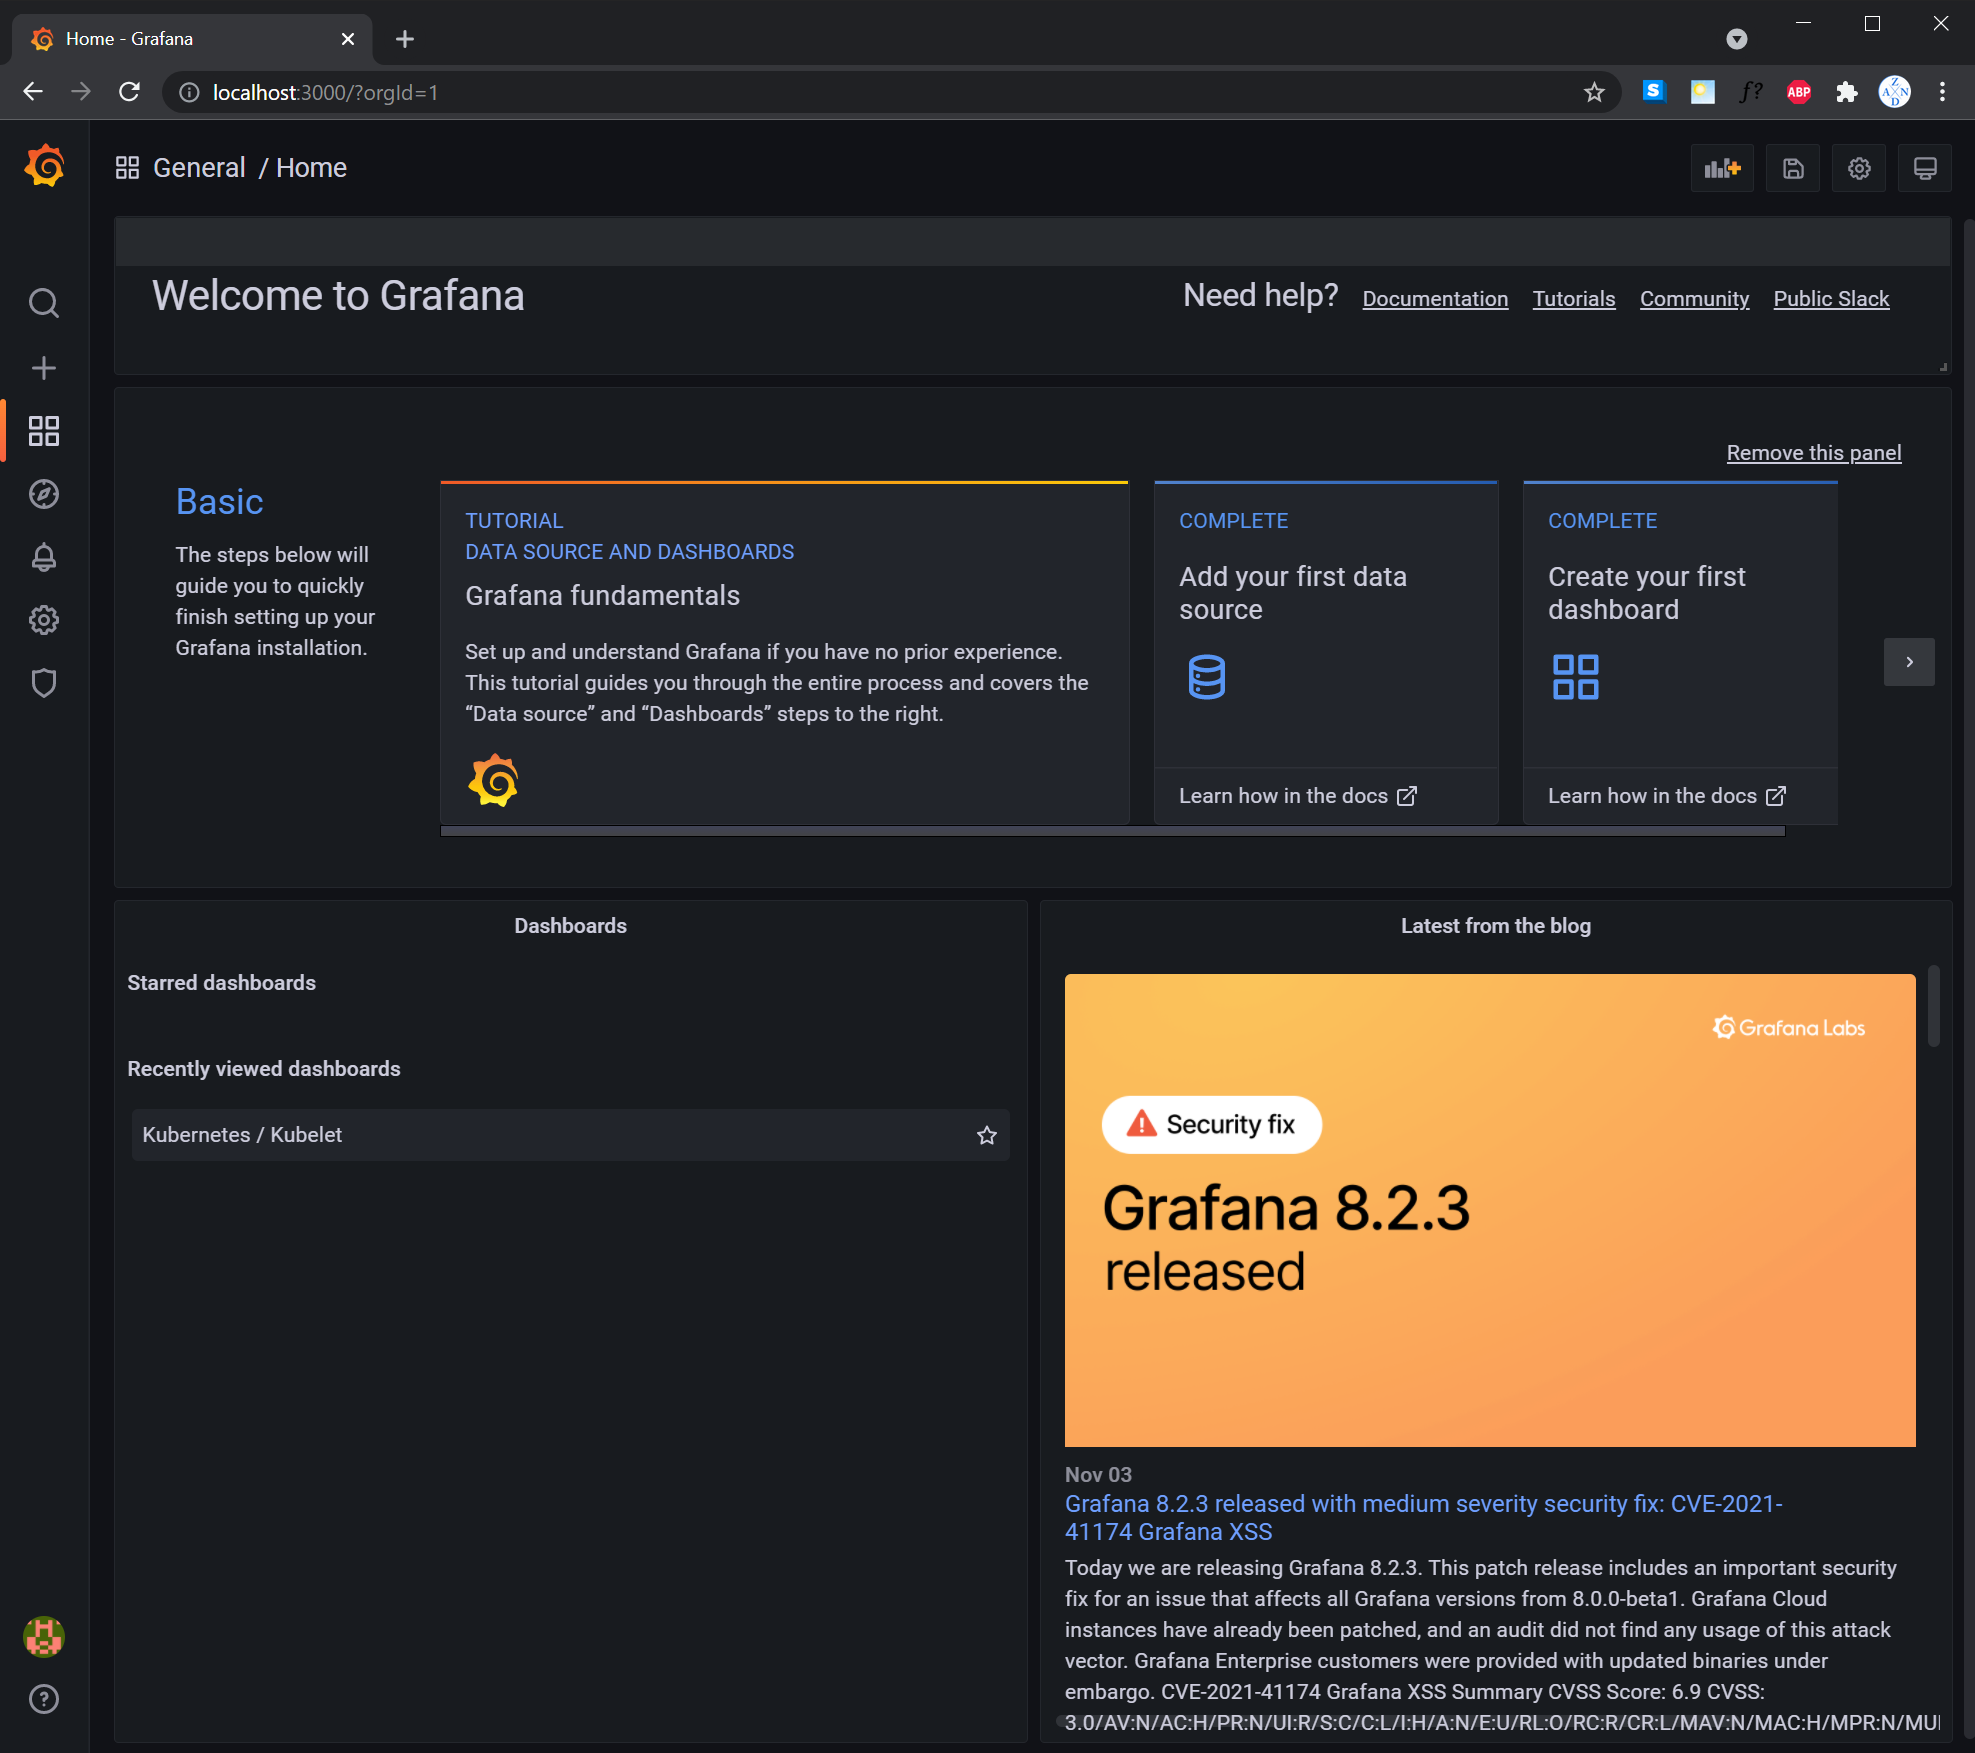
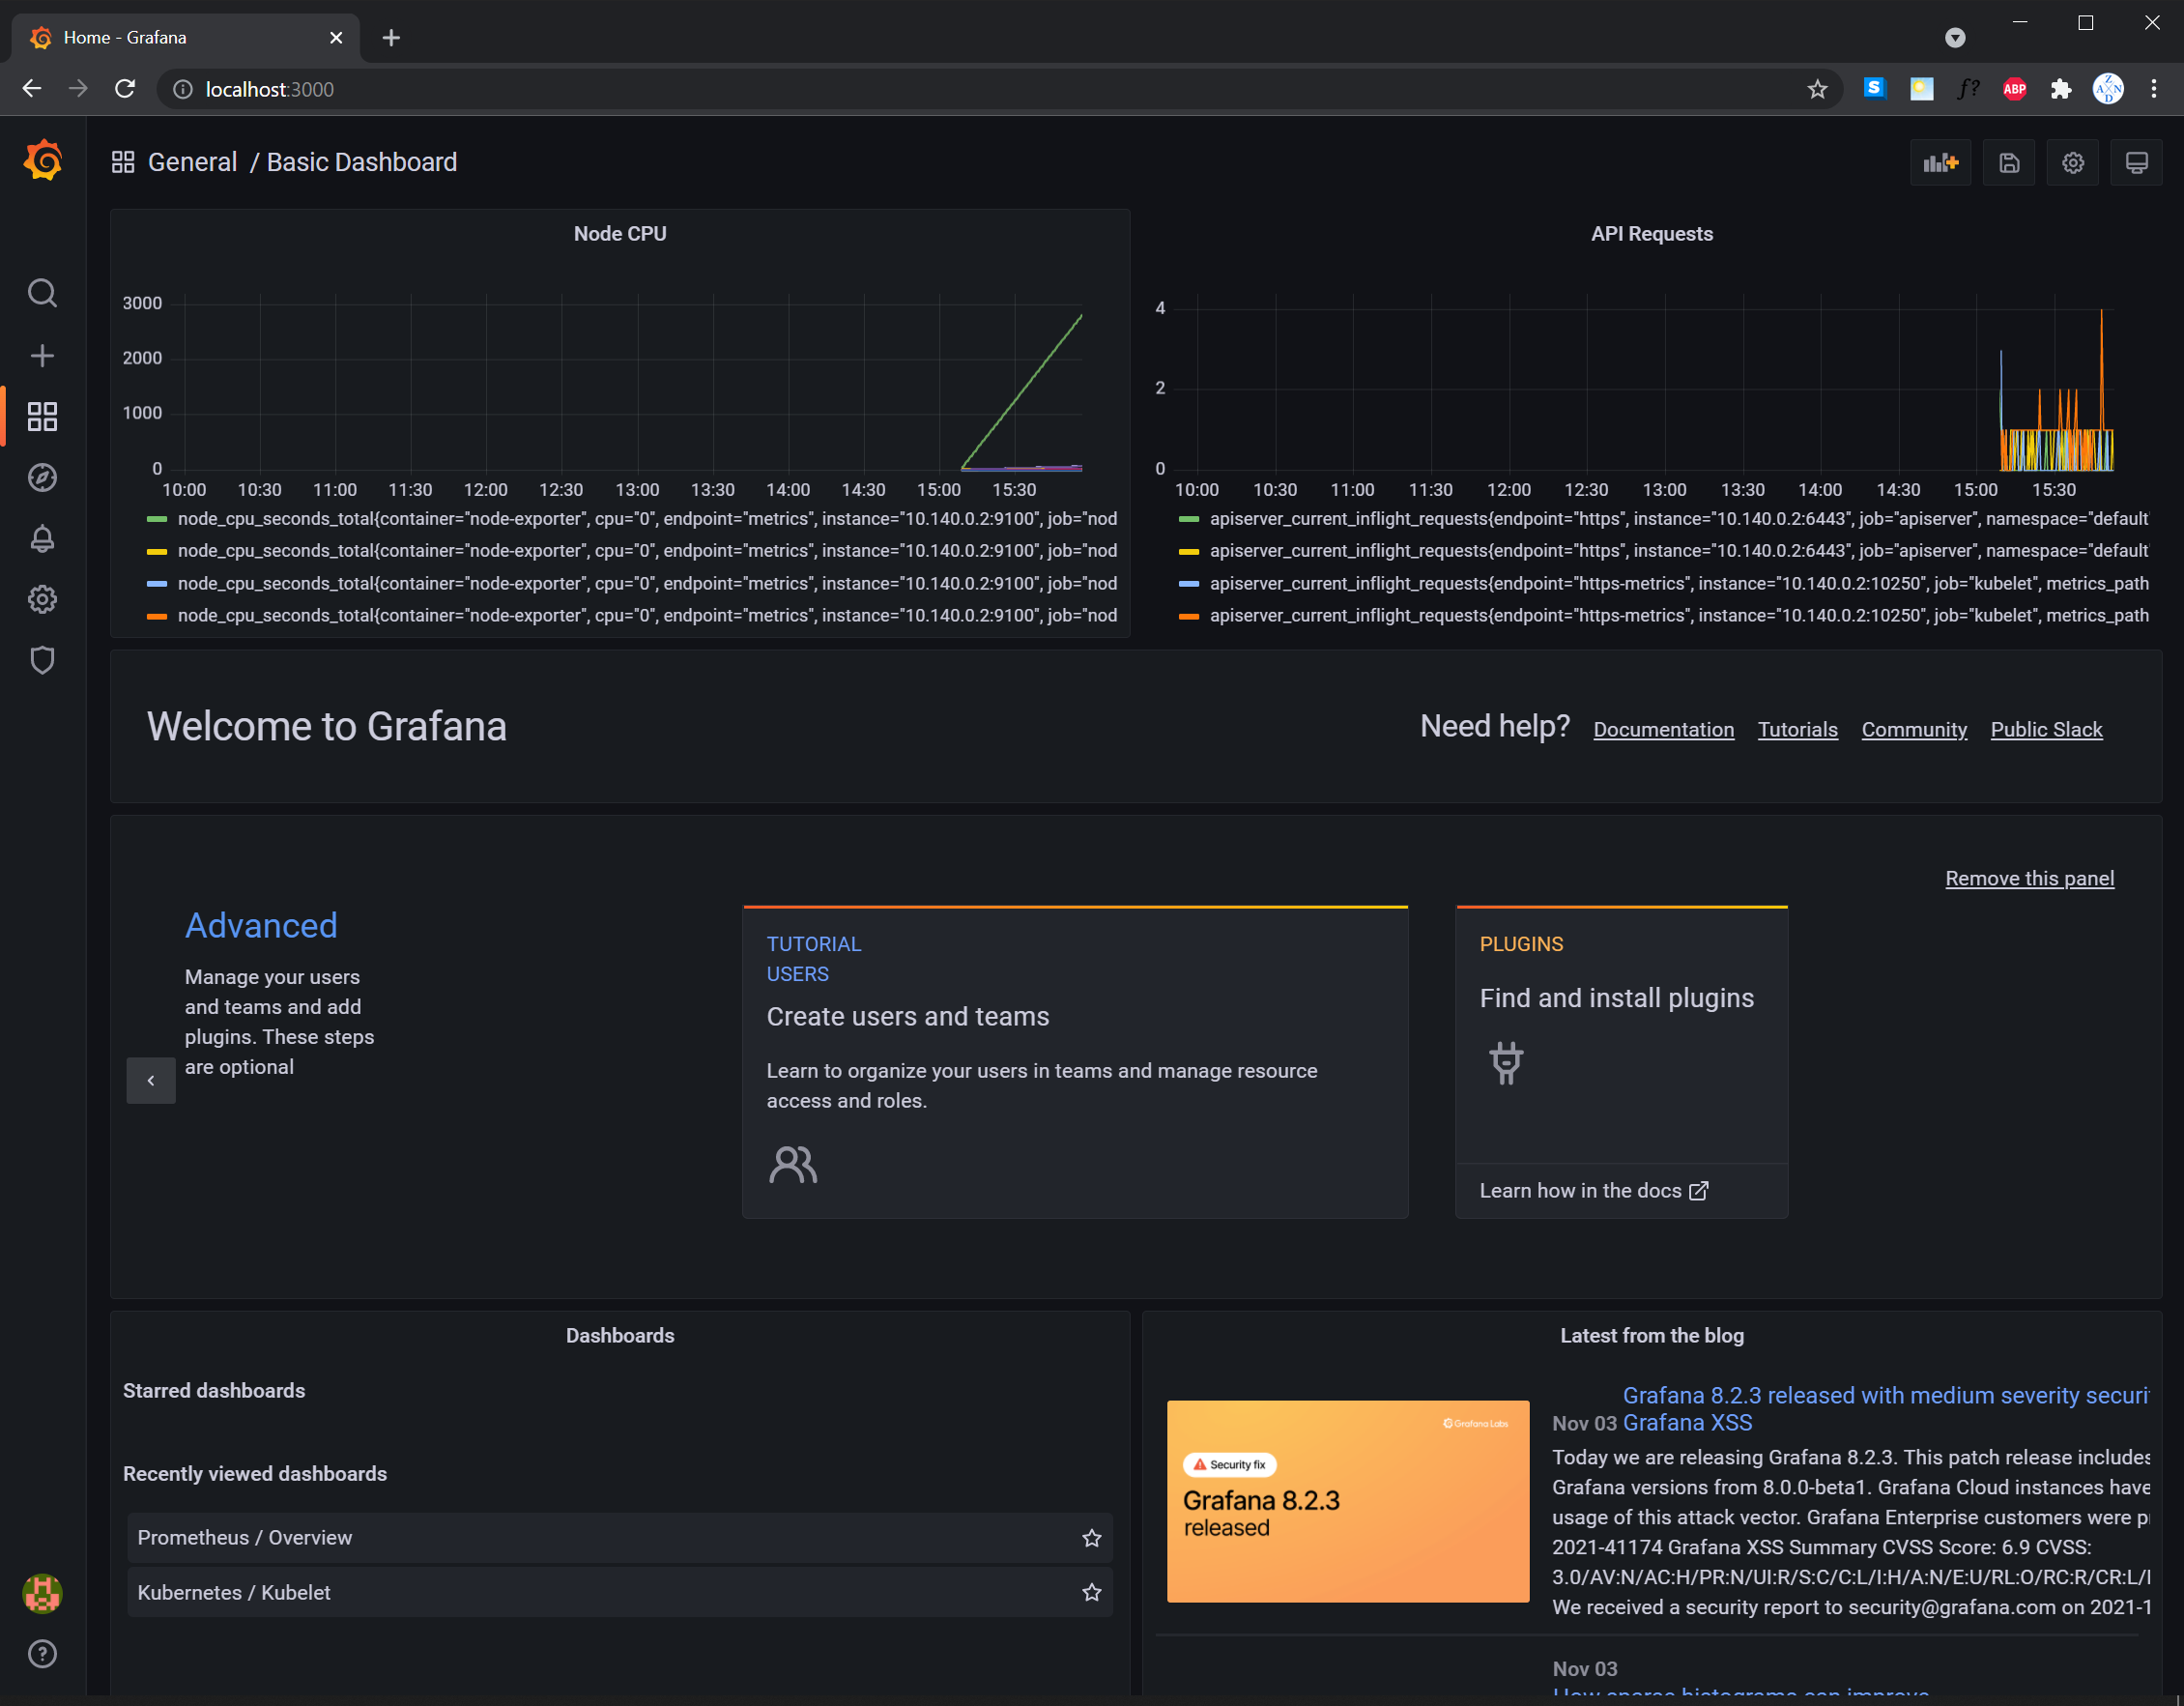
TODO: Expose Grafana to the internet and then setup Prometheus as a data source. Provide a screenshot of the home page after logging into Grafana.
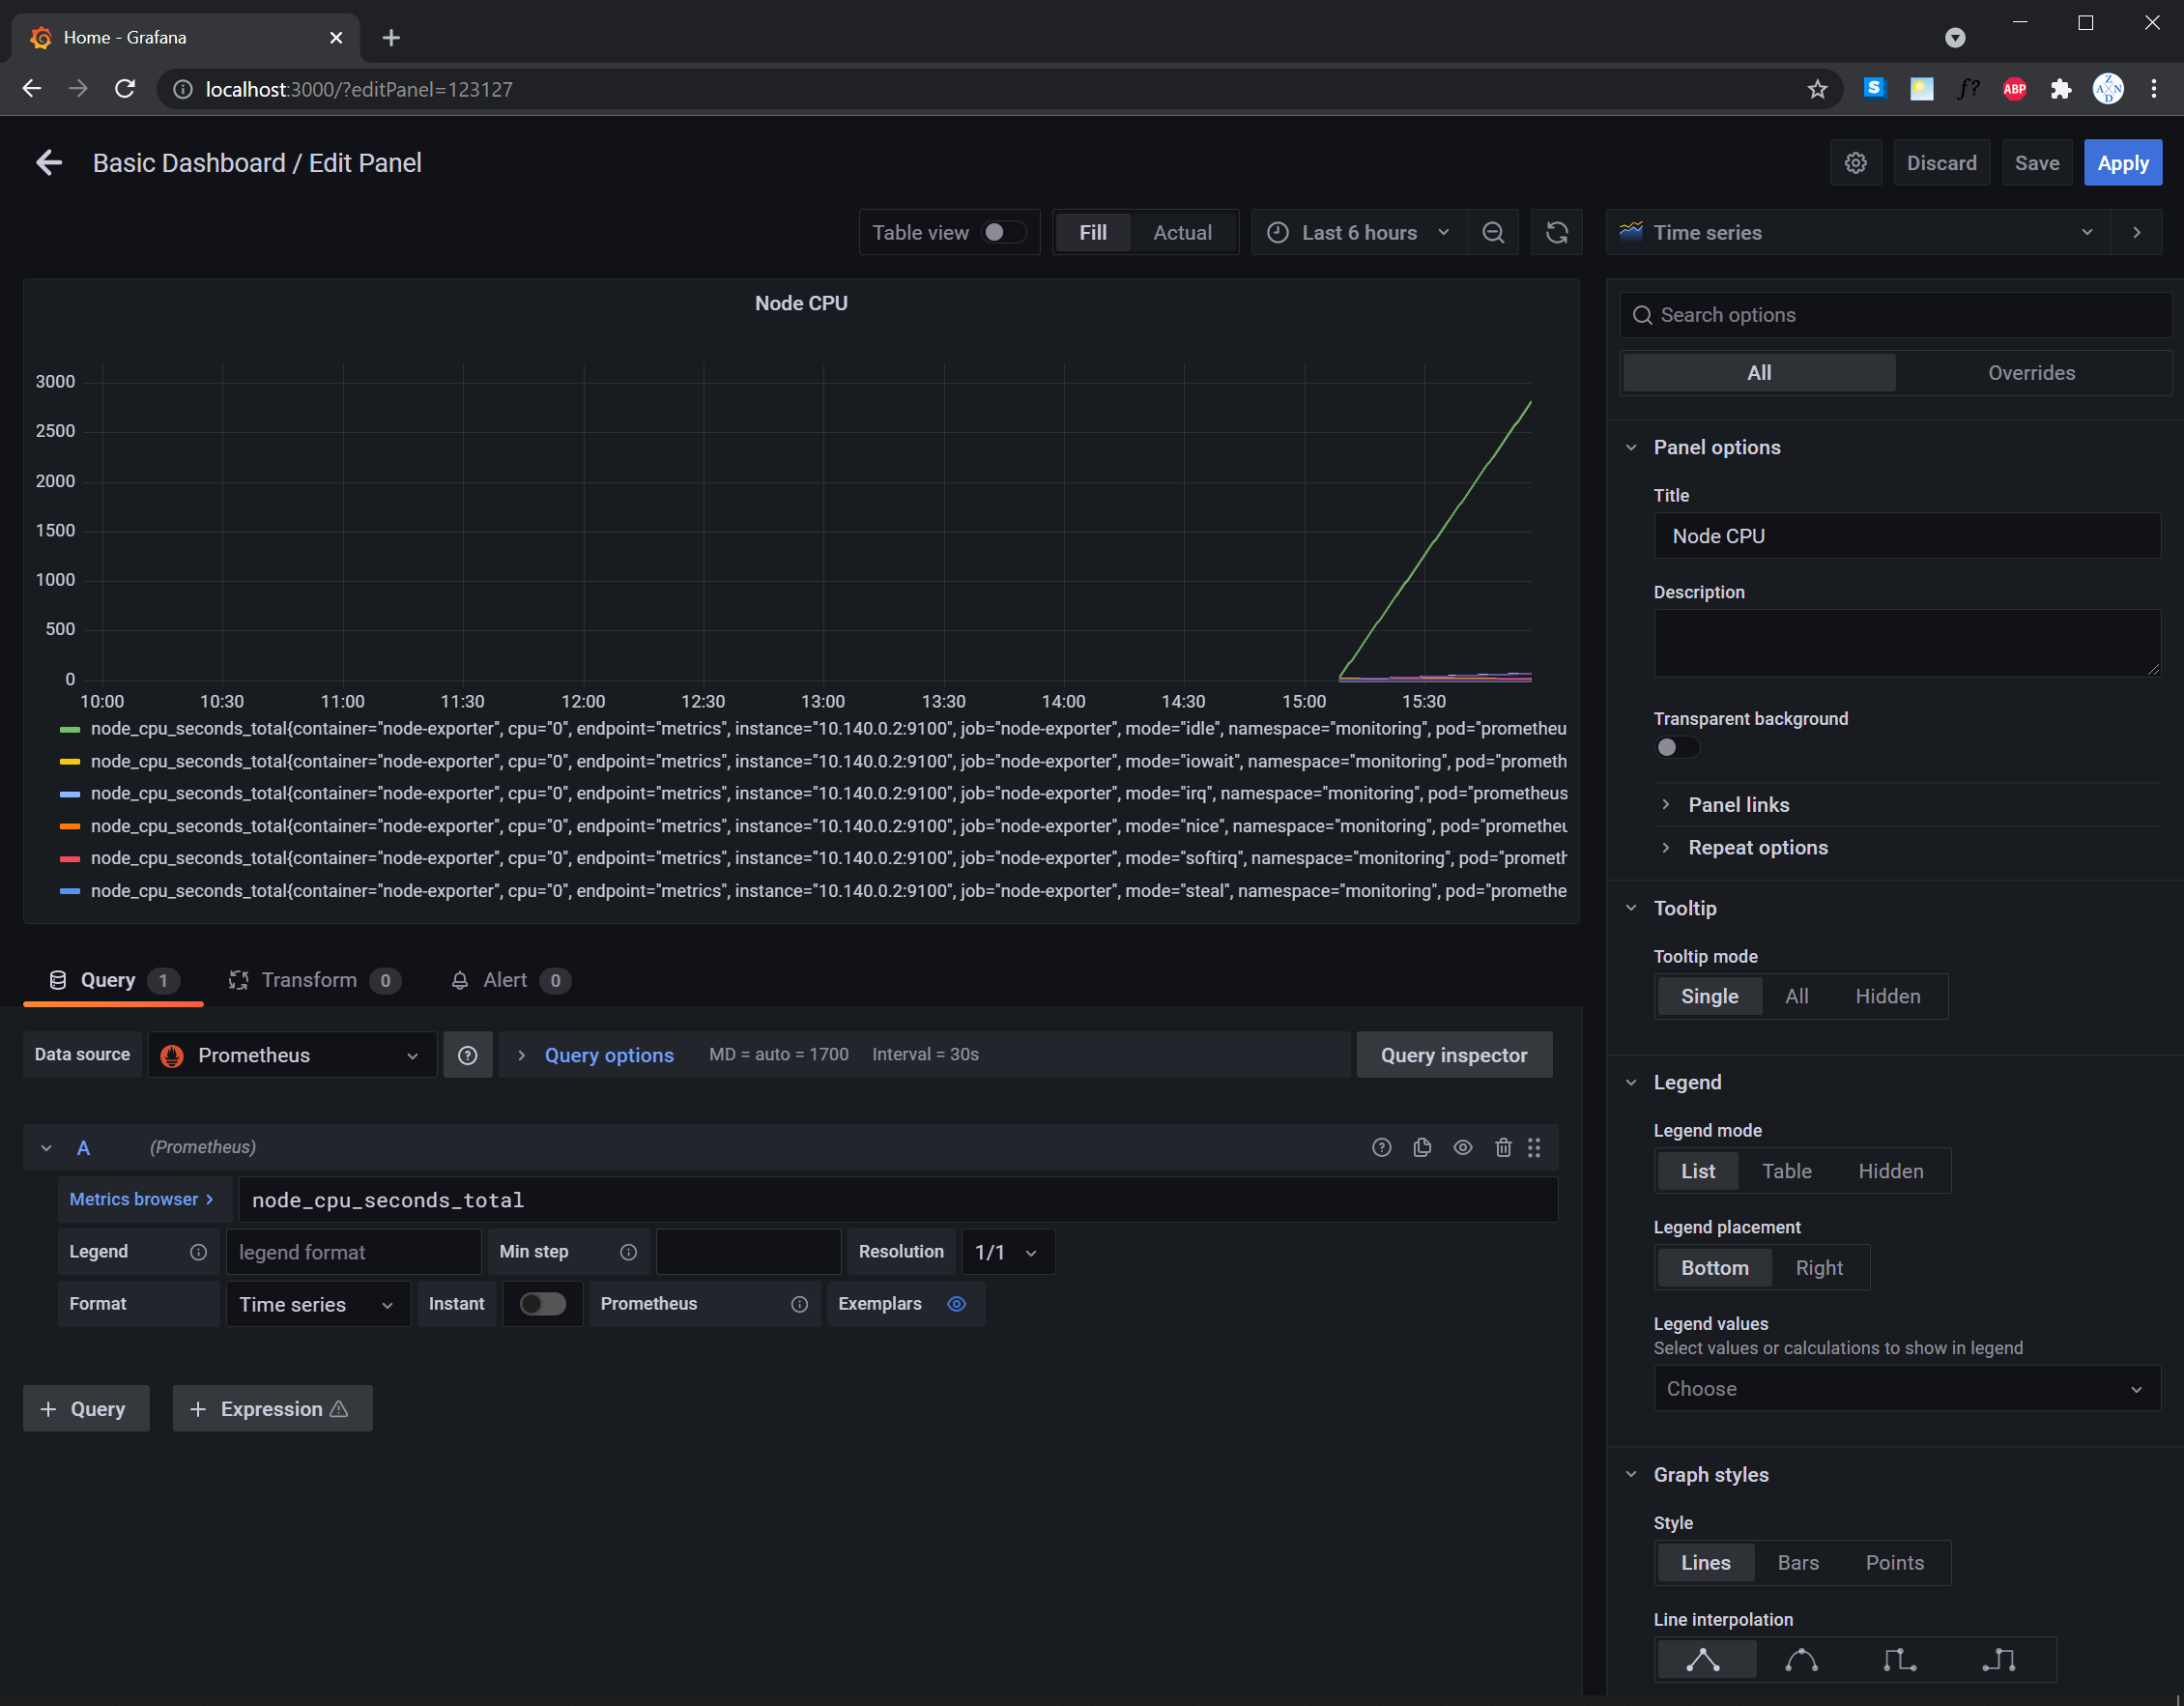
TODO: Create a dashboard in Grafana that shows Prometheus as a source. Take a screenshot and include it here.
TODO: Describe, in your own words, what the SLIs are, based on an SLO of monthly uptime and request response time.
SLIs or Service Level Indicators are measurable indicators of how the application/website/service is faring compared to the promise of the organization to its customers and stakeholders. This promise is also known as SLOs or Service Level Objectives.
An example SLI for a monthly uptime is the rate of the 20x or 30x (valid requests) responses of the website in a total incoming requests per month. For example, the average 20x or 30x responses of the web application for the month of October 2021 is 97.99%.
On the other hand, the SLI for a request response time is how long the request took to be served in actuality. For example, it took an average of 700ms for incoming requests to be served in the month of October 2021.
TODO: It is important to know why we want to measure certain metrics for our customer. Describe in detail 5 metrics to measure these SLIs.
- The average 20x or 30x responses of the web application for the month of October 2021 is 97.99%.
- It took an average of 700ms for incoming requests to be served for the month of October 2021.
- 1.5% of the total incoming requests had 50x responses for the month of October 2021.
- The average CPU usage of the web application for the month of October 2021 is 83.67%.
- The login requests in the web application for the month of October 2021 took an average of 2 seconds to be served.
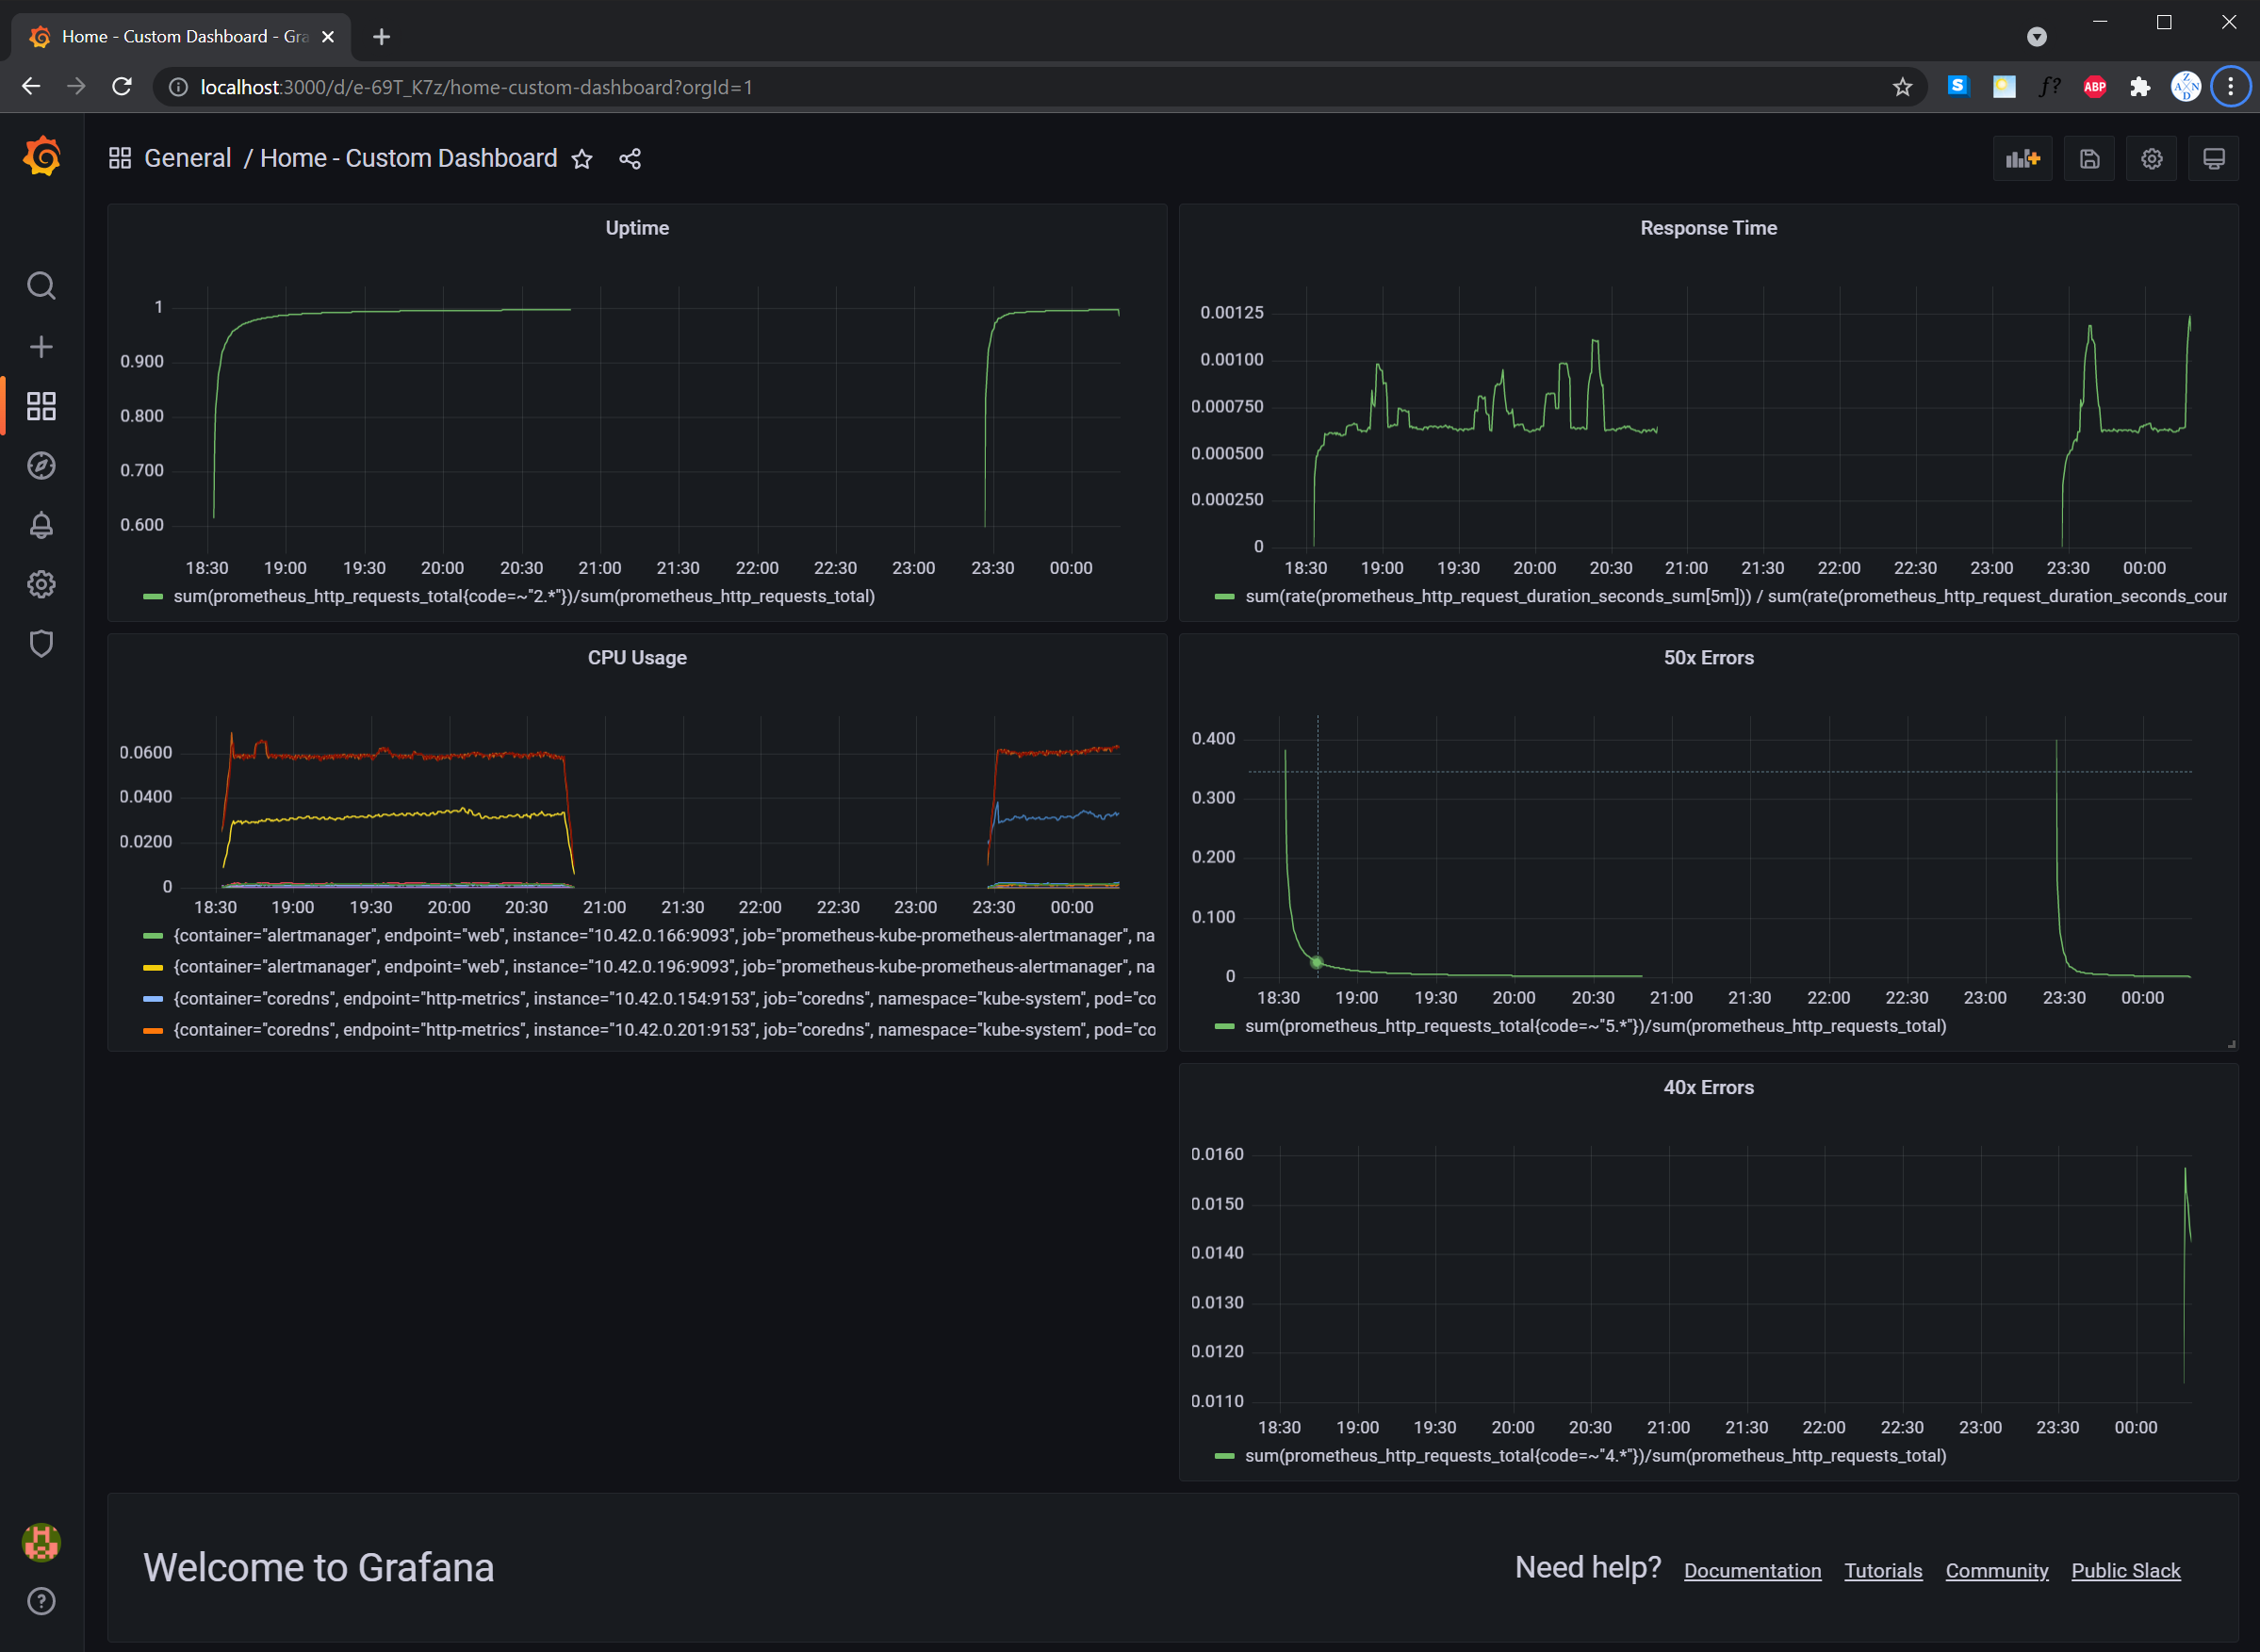
TODO: Create a dashboard to measure the uptime of the frontend and backend services We will also want to measure 40x and 50x errors. Create a dashboard that show these values over a 24 hour period and take a screenshot.
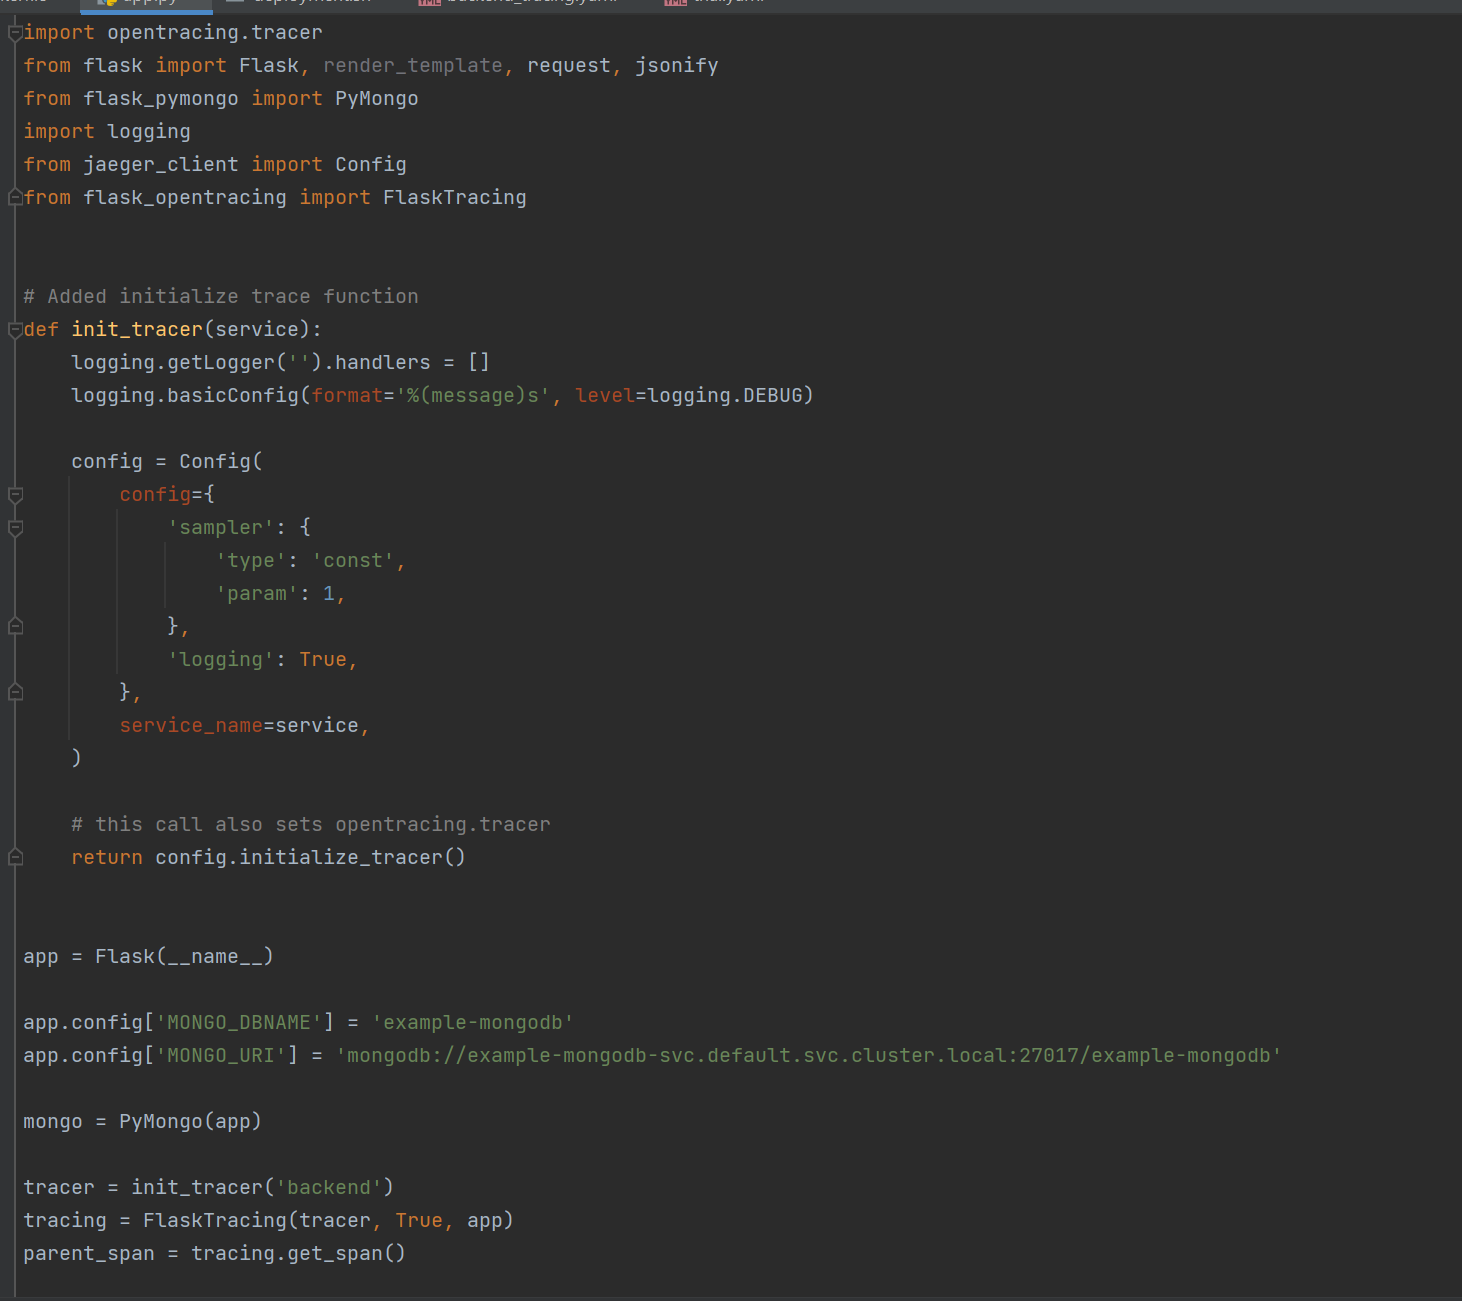
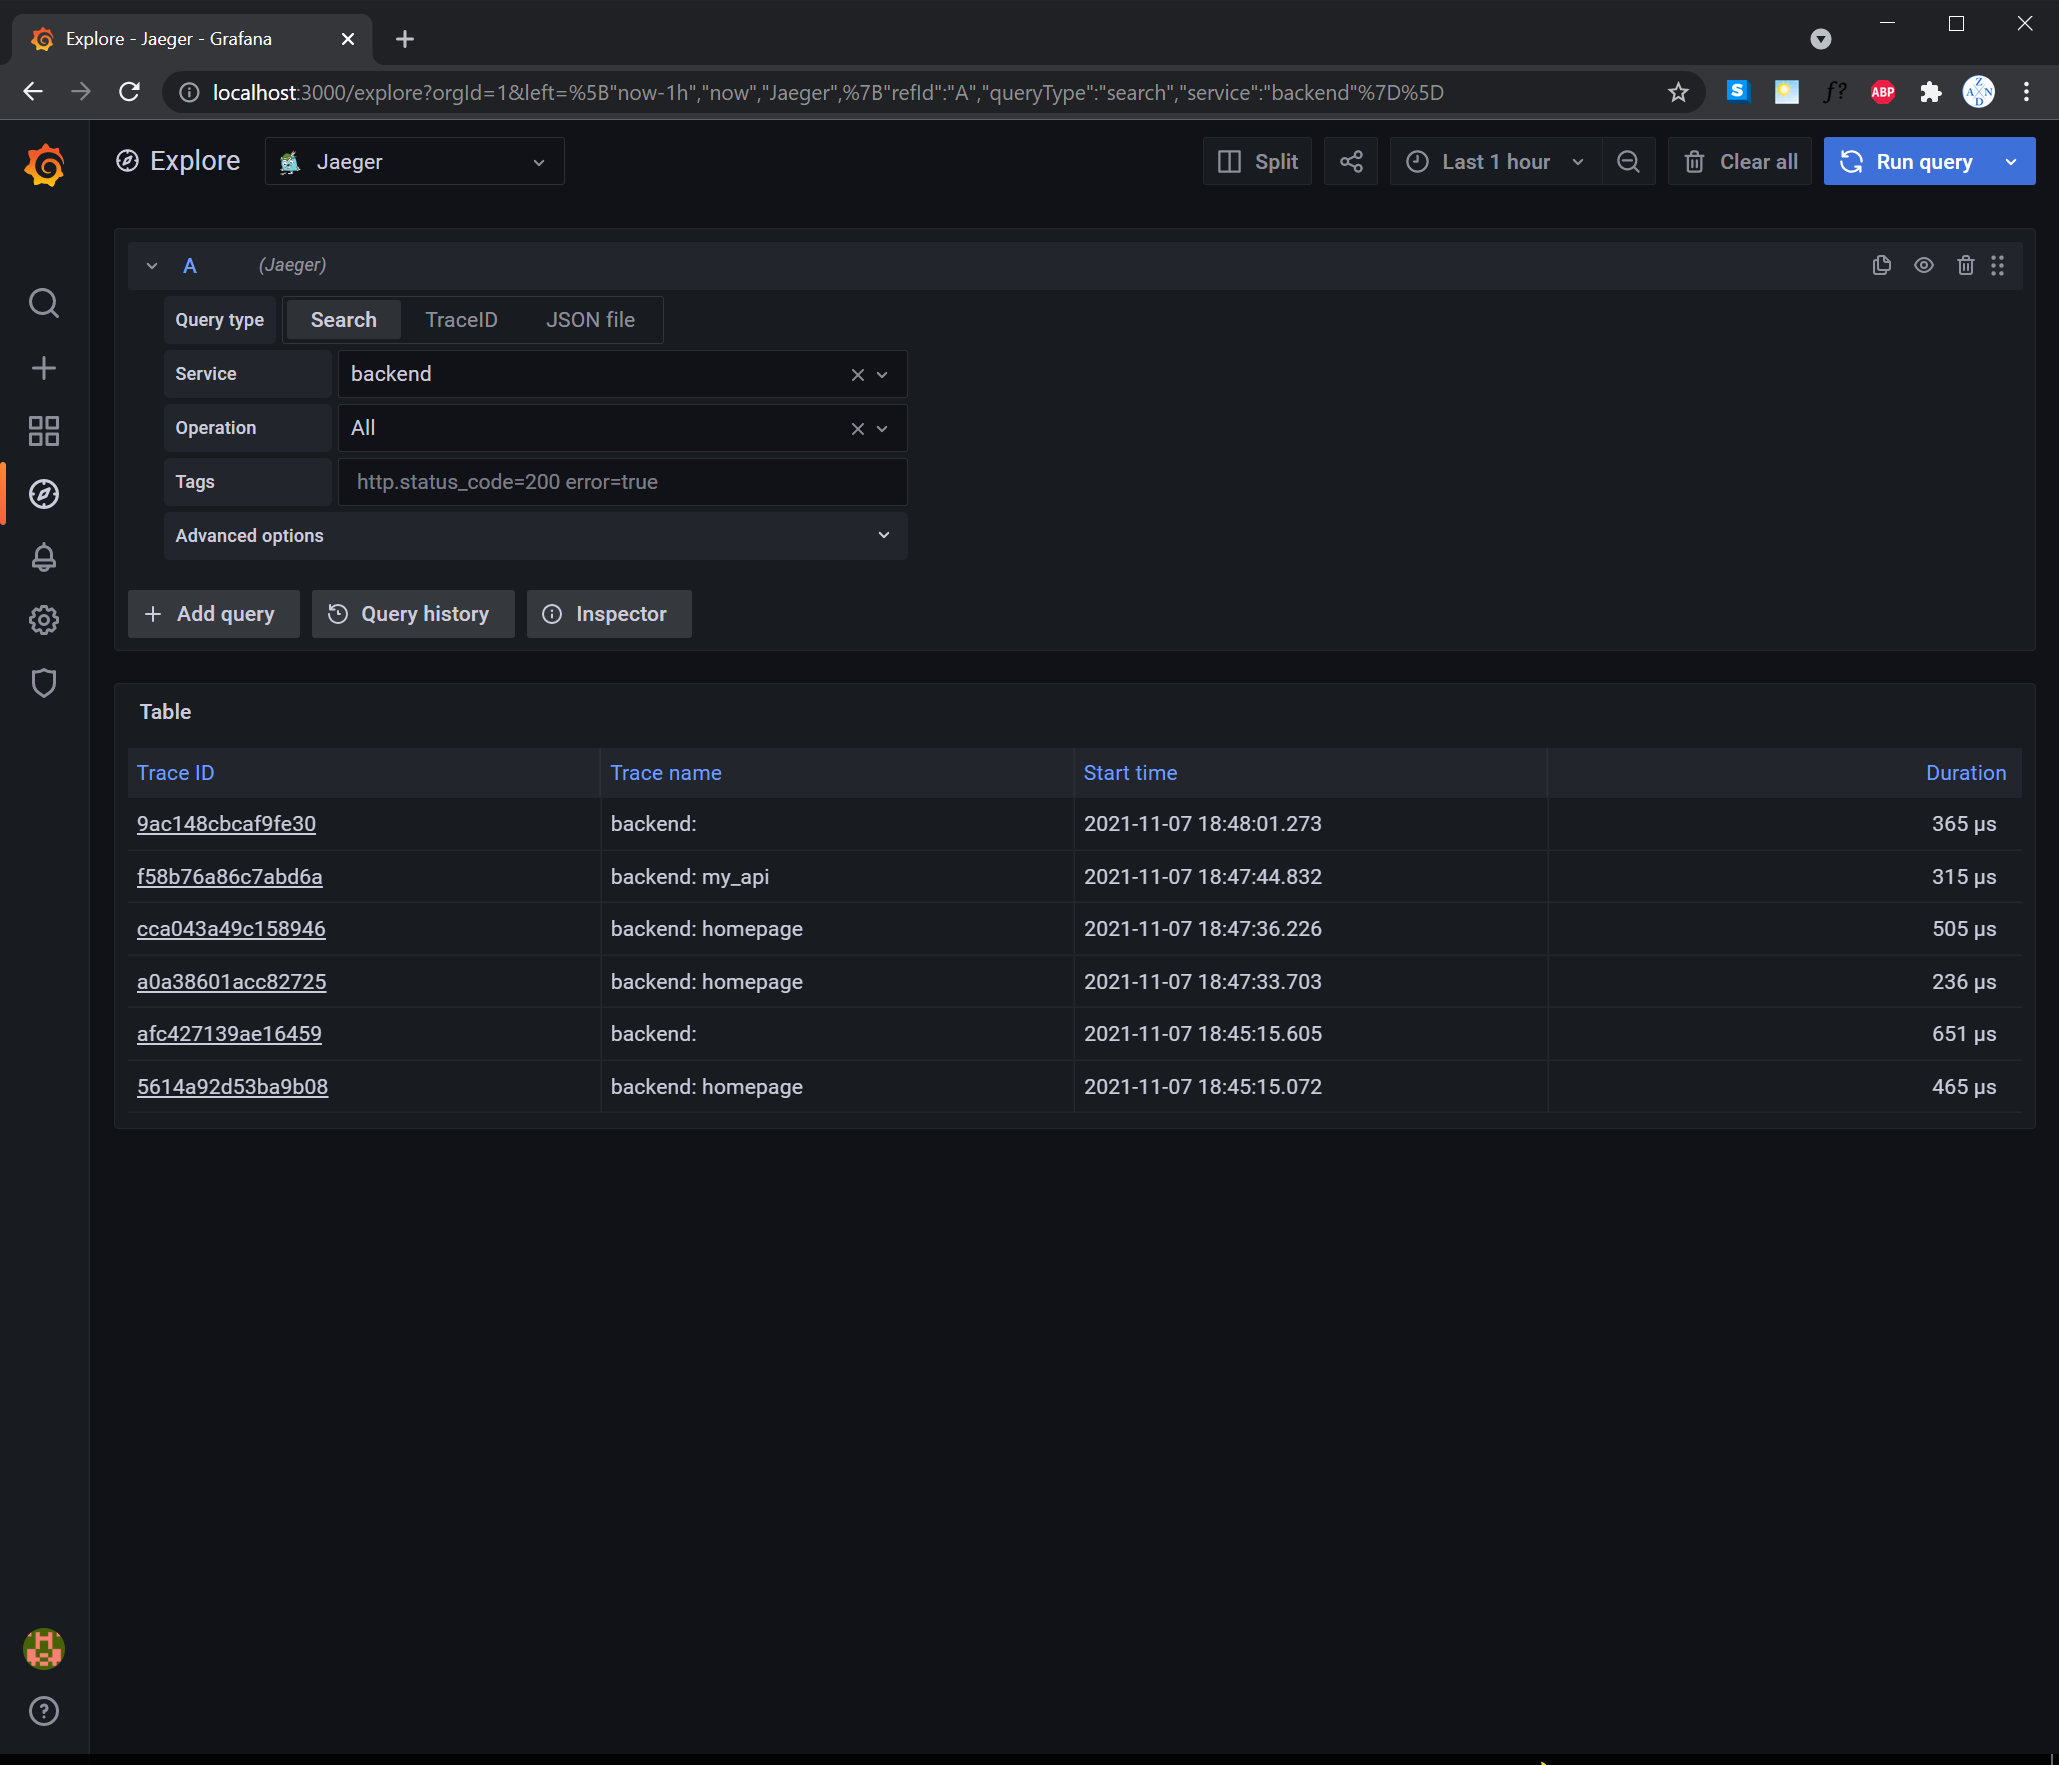
TODO: We will create a Jaeger span to measure the processes on the backend. Once you fill in the span, provide a screenshot of it here.
TODO: Now that the trace is running, let's add the metric to our current Grafana dashboard. Once this is completed, provide a screenshot of it here.
TODO: Using the template below, write a trouble ticket for the developers, to explain the errors that you are seeing (400, 500, latency) and to let them know the file that is causing the issue.
TROUBLE TICKET
Name: Juan dela Cruz
Date: November 6, 2021
Subject: Backend service's star endpoint shows "Method Not Allowed" error 405.
Affected Area: star endpoint
Severity: High
Description: The Mongo database connection cannot be found. The tracer span is 2f33c63.
TODO: We want to create an SLO guaranteeing that our application has a 99.95% uptime per month. Name three SLIs that you would use to measure the success of this SLO.
SLOs:
- 99.95% of uptime per month
- .03% of 40x/50x responses per month.
- Application responses should be served within 1500 ms per month.
- Monthly average CPU usage should be 60% or less.
- Monthly average memory usage should not exceed 600Mib.
SLIs:
- The average 20x or 30x responses of the web application for the month of October 2021 is 97.99%.
- 1.5% of the total incoming requests had 50x responses for the month of October 2021.
- It took an average of 1070 ms for incoming requests to be served for the month of October 2021.
- The average CPU usage of the application is 42.65% for the month of October 2021.
- The average memory usage of the application is 300Mib for the month of October 2021.
TODO: Now that we have our SLIs and SLOs, create KPIs to accurately measure these metrics. We will make a dashboard for this, but first write them down here.
- The average 20x or 30x responses of the web application for the month of October 2021 is 97.99%.
- Monthly uptime - this KPI indicates the total usability of the application.
- 20x code responses per month - this KPI indicates availability of the pages of the application.
- Monthly traffic - this KPI will indicate the number of requests served by the application.
- 1.5% of the total incoming requests had 50x responses for the month of October 2021.
- Monthly downtime - this KPI indicates the number of times the application was down
- Errors per month - this KPI will indicate the monthly errors encountered in the application.
- Monthly traffic - this KPI will indicate the number of requests served by the application.
- It took an average of 1070 ms for incoming requests to be served for the month of October 2021.
- Average monthly latency - this KPI will indicate the time it took for the application to respond to requests.
- Monthly uptime - this KPI indicates the total usability of the application.
- Monthly traffic - this KPI will indicate the number of requests served by the application.
- The average CPU usage of the application is 42.65% for the month of October 2021.
- Average monthly CPU usage of pod used by the application - this KPI will indicate how much CPU is used by the source pod of the application.
- Average monthly CPU usage of all the pods - this KPI will indicate how much CPU is used by all the pods required to run the application.
- Monthly quota limit - this KPI will indicate whether the application is exceeding its usage of the CPU quota.
- The average memory usage of the application is 300Mib for the month of October 2021.
- Average monthly memory usage of pod used by the application - this KPI will indicate how much memory is used by the source pod of the application.
- Average monthly memory usage of all the pods - this KPI will indicate how much memory is used by all the pods required to run the application.
- Monthly quota limit - this KPI will indicate whether the application is exceeding its usage of the memory quota.
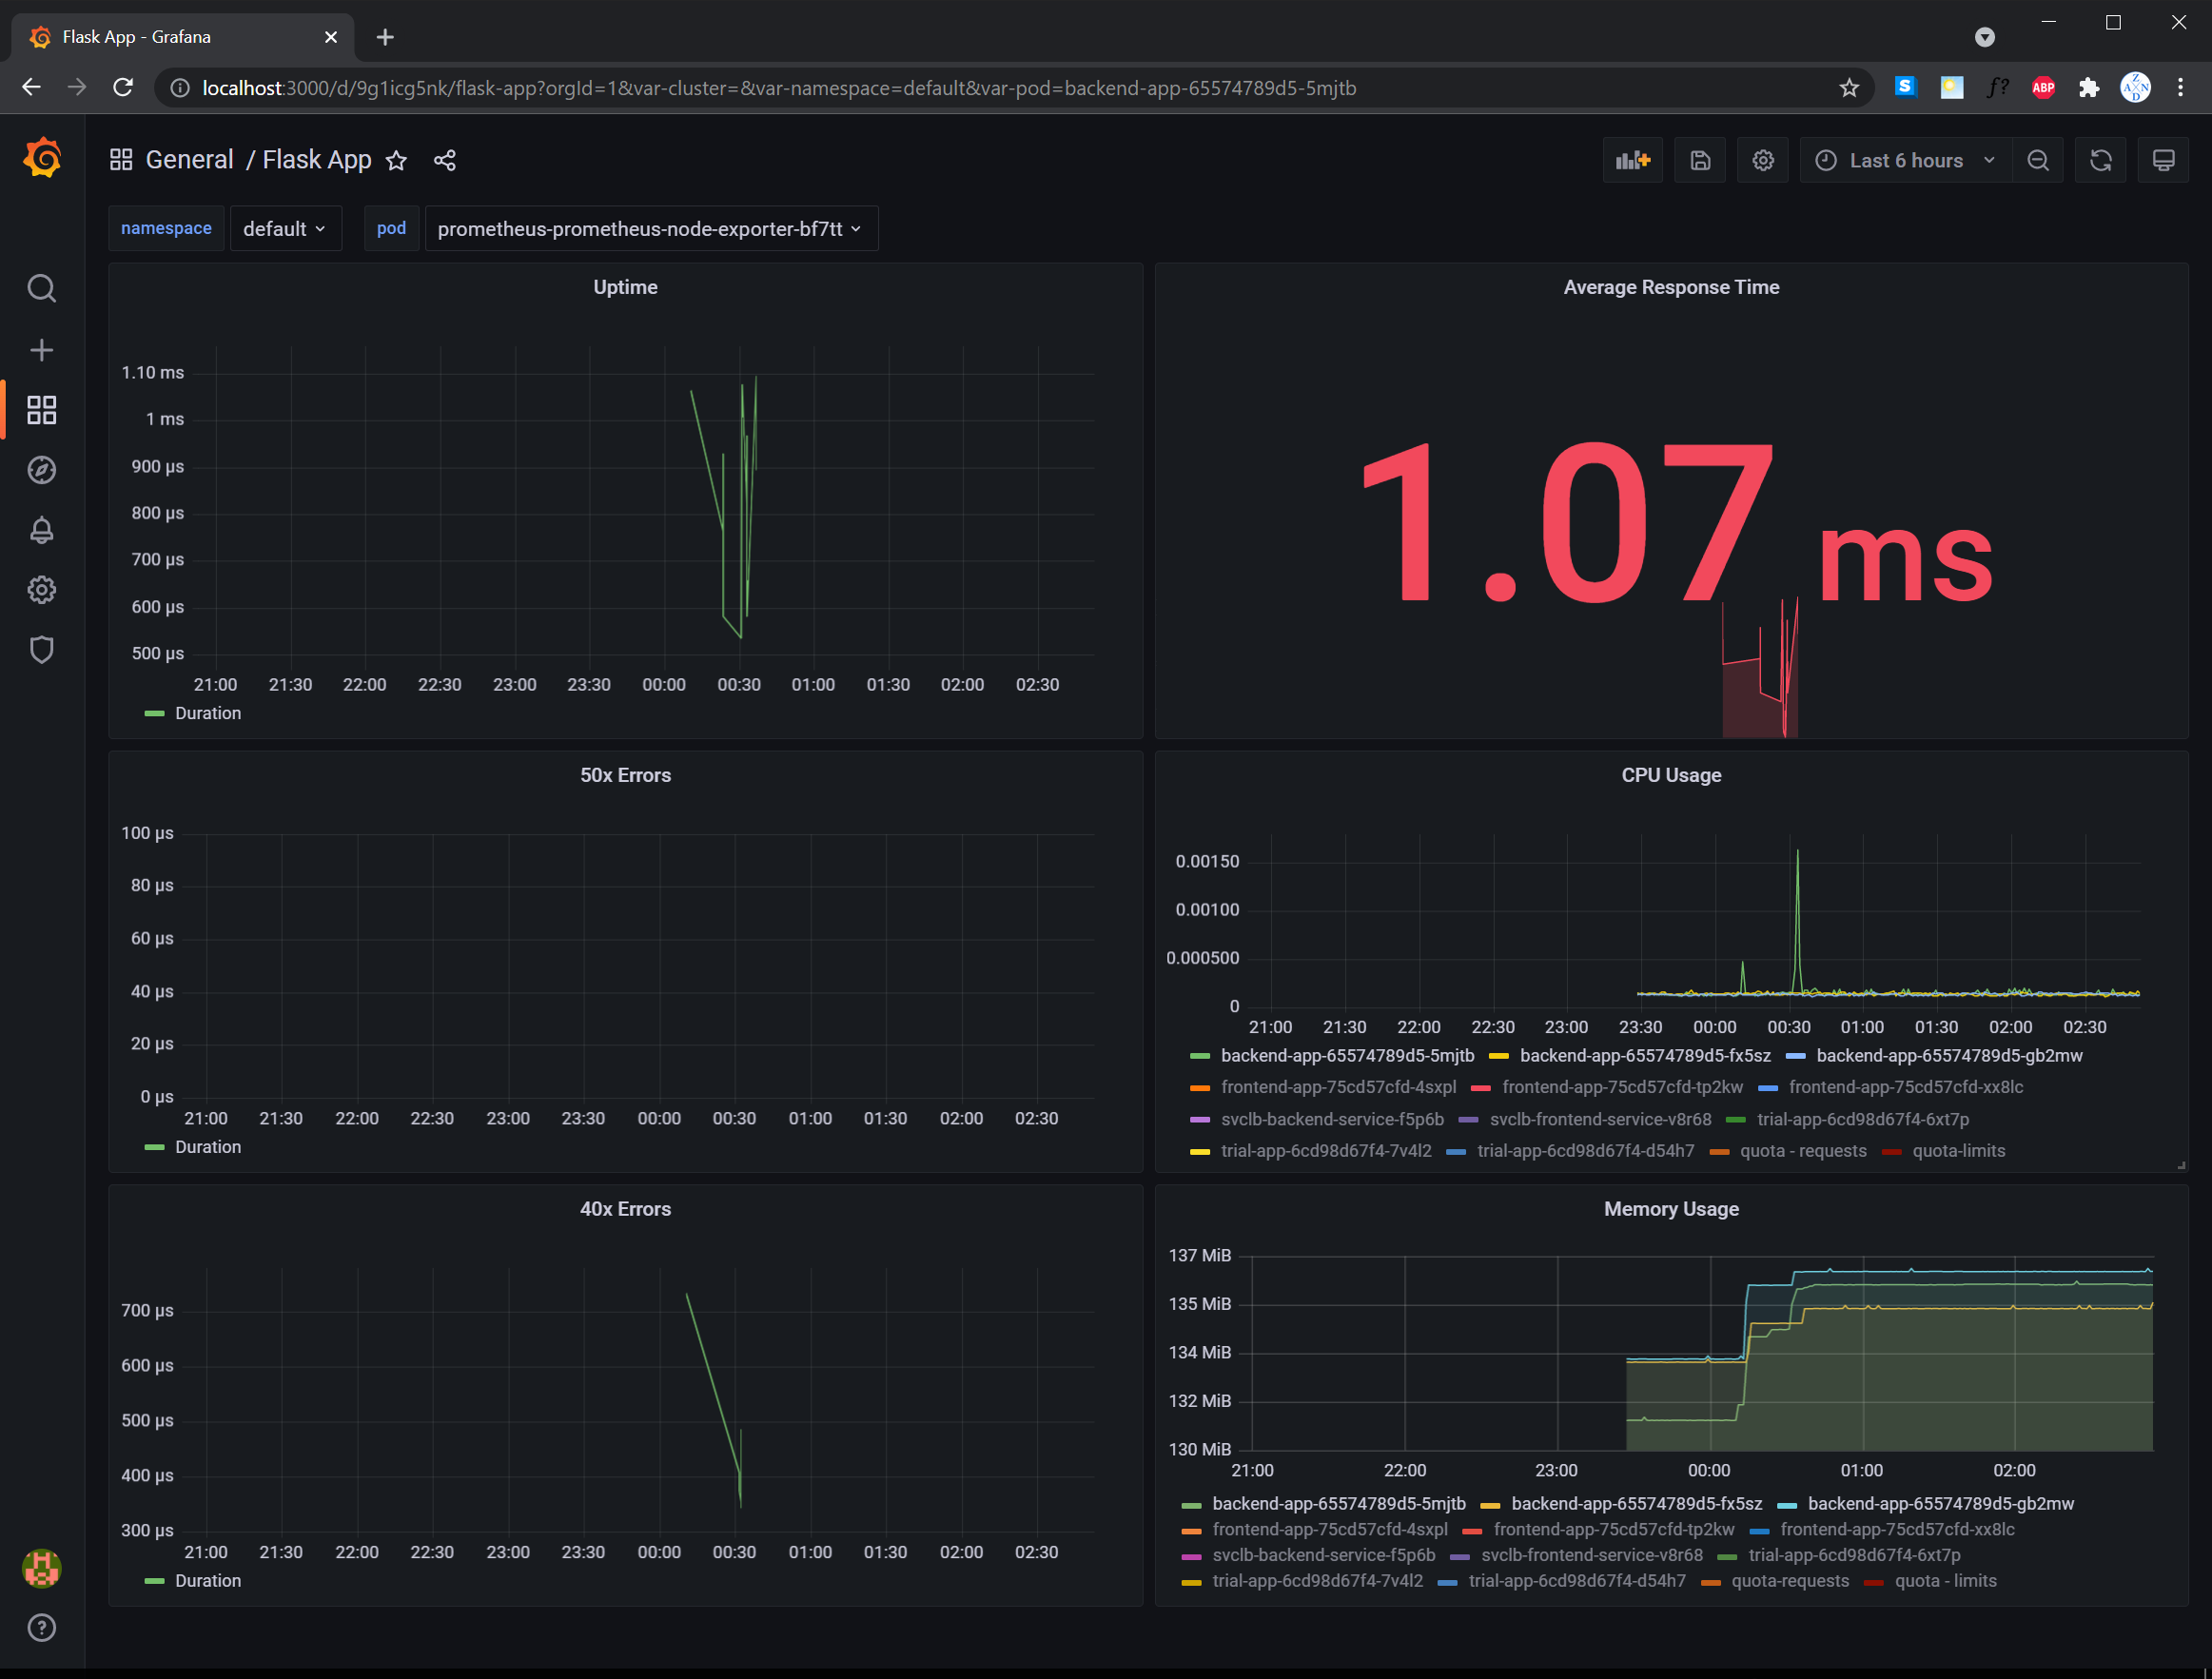
TODO: Create a Dashboard containing graphs that capture all the metrics of your KPIs and adequately representing your SLIs and SLOs. Include a screenshot of the dashboard here, and write a text description of what graphs are represented in the dashboard.
- Uptime panel - this represents the 20x/30x (successful) responses of the application.
- 50x and 40x Errors panel - these represents the 40x/50x (error) responses of the application.
- Average Response Time panel - this represents the average response time of the application per request.
- CPU Usage panel - this represents the CPU usage of the backend application. This also provides an option to select a few pods for comparison and consolidate the total CPU usage of all the pods per namespace.
- Memory Usage panel - this represents the memory usage of the backend application. This also provides an option to select a few pods for comparison and consolidate the total memory usage of all the pods per namespace.
