-
Notifications
You must be signed in to change notification settings - Fork 17
3D_Nuclei_Clustering_Tool
Analyze the clustering behavior of nuclei in 3D images. The centers of the nuclei are detected. The nuclei are filtered by the presence of a signal in a different channel. The clustering is done with the density based algorithm DBSCAN. The nearest neighbor distances between all nuclei and those outside and inside of the clusters are calculated.
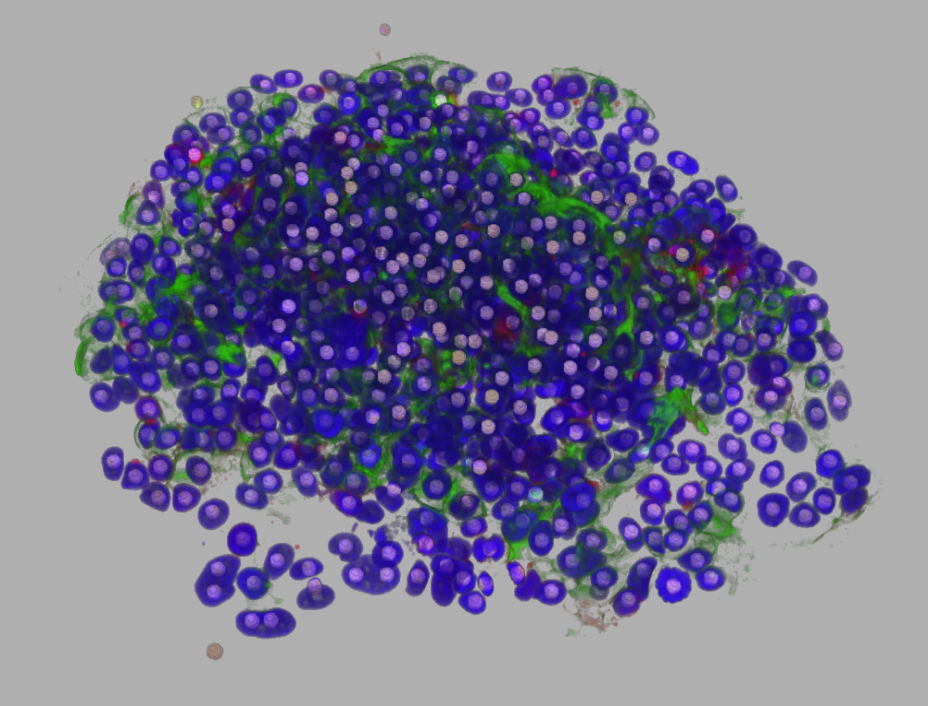
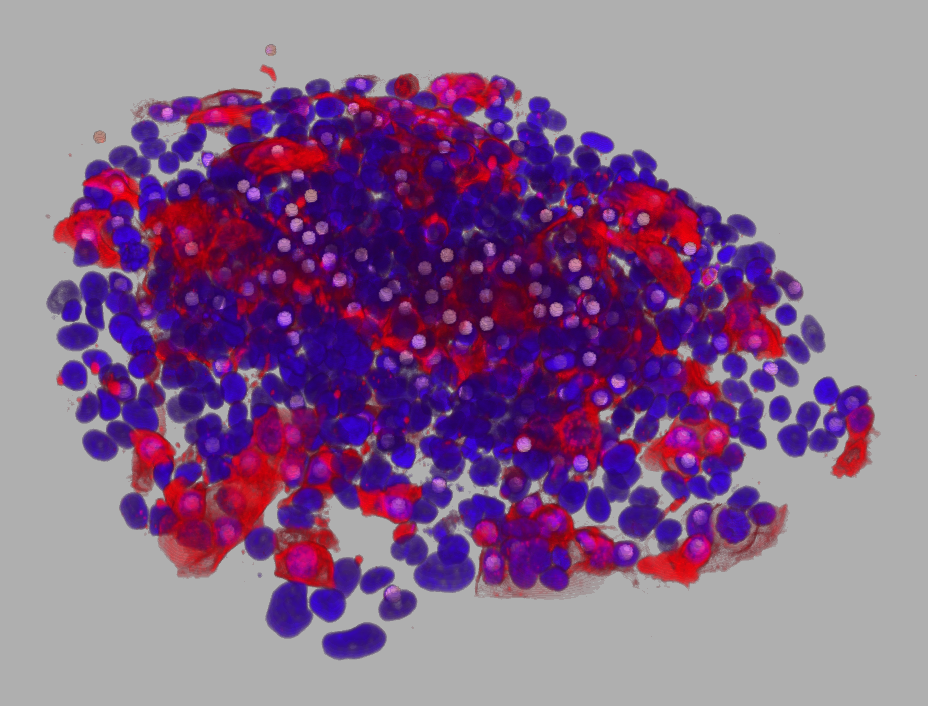


You can download an example data-set:
The source code in git-hub can be found here.
You must have the 3D ImageJ Suite [1] and FeatureJ installed. They are available via the FIJI-update-sites 3D ImageJ Suite and ImageScience.
To install the tool save the three files 3D_nuclei_clustering.ijm, dbscan_clustering_3D.py and nearest_neighbor_distances_3D.py into the folder macros/toolsets of your FIJI installation.
Select the "3D_nuclei_clustering" toolset from the >> button of the ImageJ launcher.
- the first button (the one with the image) opens this help page
- the
p-button runs the complete analysis on the active image - the
b-button runs the batch analysis on all images in a folder
The remaining buttons execute one of the steps of the analysis at a time. This can be helpful for finding the best option-values.
- the
d-button detects the nuclei in the image - the
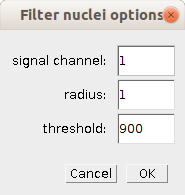
f-button filters the nuclei, so that only nuclei with an intensity above a threshold in another channel remain. - the
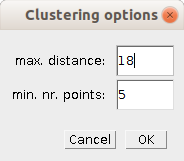
c-button runs the cluster analysis. - the
n-button calculates the nearest-neighbor distances for the active table - the
v-button visualizes the nearest-neighbor connections - the images menu-button allows to download an example dataset and to open the contained images
The centres of the 3D-nuclei will be detected using spot-detection. First a 3D-LoG is applied to the nuclei-channel. Then the 3D local maxima above a noise threshold are detected. If the mean intensity around the centre of the nucleus (2D) is above the given threshold the coordinates of the nucleus are kept for the cluster analysis. DBScan clustering is used on the 3D coordinates of the centres of the nuclei to form the clusters and the nearest-neighbour distances for all positive nuclei, the unclustered nuclei and the clustered nuclei are calculated. The nn-distances for the clustered nuclei are calculated per cluster.
Detects, filters and finds the clusters of the nuclei on the active image. You might first want to try the single steps, detect nuclei, filter above threshold and cluster nuclei and set the option values appropriate for your images (see below).
Open an image, set the nuclei channel (options of the d-button) and the signal channel (options on the f-button). Press the p-button to run the analysis on the image.
3 output channels will be added to the image. Each channel will tag certain nuclei by drawing a sphere of radius 3 in the spatial units of the image, for example µm.
- The spheres in output channel 1 tag all detected nuclei
- The spheres in output channel 2 tag all detected nuclei with a signal above the threshold in the signal channel
- The spheres in output channel 3 tag the nuclei in clusters. The pixel-value of each sphere represents number of the cluster to which the nucleus belongs.
4 tables will be created.
- The table
clusterscontains contains the coordinates of all nuclei that belong to a cluster. - The table
unclusteredcontains the coordinates of the nuclei that do not belong to a cluster - The table
Resultscontains the coordinates of all positive nuclei - The table
cluster analysis of nucleicontains the summary of the analysis
The columns of the nuclei tables are:
- The
NRcolumn displays the index of the nucleus (starting with 1) - The
X,Y,Zcolumns are the 3D coordinates. - The
C-column indicates the number of the cluster to which the nucleus belongs. - The
nn. distcolumn shows the nearest-neighbour distance of the nucleus - The
neighborcolumn shows the index of the nearest neighbour of the nucleus
The columns of the summary table are:
- title
- total nr. of nuclei
- nr. of nuclei above thr.
- nr. of clusters
- clustered
- unclustered
- mean nn-distance all
- stddev. all
- mean nn-distance unclustered
- stddev. unclustered
- mean nn-distance clustered
- stddev. clustered
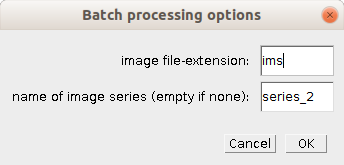
Set the options for the nuclei detection (d-button), the filtering (f-button) and the clustering (c-button). Right click on the b-button to open the options-dialog for the batch processing. Enter the file-extension of your input images. If the input images contain multiple series you can set the series to be used, otherwise remove the text from this input-field. Press the b-button and select the folder containing the input images.
The results will be written into a subfolder of the input folder.
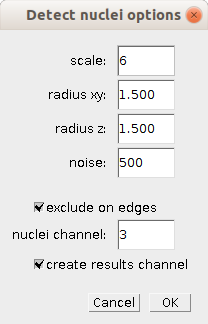
Right-click one of the buttons b, d, f or c to open the options-dialog of each analysis step.
- image file-extension
- The file extension of the input images
- name of the image series (empty if n none)
- The series in the image file that will be used. If your image files do not contain series enter an empty text.
- scale
- The smoothing scale of the LoG filter used in the detection of the nuclei.
- radius xy
- The radius of the spots in the x and y dimension for the 3D maximum detection.
- radius z
- The radius of the spots in the z dimension for the 3D maximum detection.
- noise
- The noise value for the 3D maximum detection. Only local maxima above the noise-value are detected.
- exclude on edges
- If selected no nuclei will be detected on the first and last slice of the stack (recommended).
- nuclei channel
- The number of the channel containing the nuclei.
- create results channel
- If selected a channel containing spheres, indicating the detected nuclei, is added to the stack.
- signal channel
- The channel containing the signal by which the nuclei will be filtered.
- radius
- The radius of the circle (2D) in which the mean intensity is measured
- threshold
- The threshold value above which the nuclei are kept for the clustering
- max. distance
- The maximum distance for the DBScan-clustering algorithm [2]
- min. nr. points
- The minimum number of points in a neighbourhood to create a cluster. Should be chosen at least 3. However, larger values are usually better for data sets with noise and will yield more significant clusters. As a rule of thumb, 2·dim can be used, but it may be necessary to choose larger values for very large data, for noisy data or for data that contains many duplicates
- input dataset directory
- The base directory for datasets. A sub-directory `spheroids` will be created in the base directory. The images of the dataset will be downloaded into this directory.
You can also skip the nuclei detection and filtering and apply the clustering from a Results-table from another source. The name of the table must be Results. If that is not the case, rename the table accordingly. The tool expects a table with the columns X, Y and Z, containig the spatially calibrated coordinate values. It also expects a 16-bit input image with a corresponding spatial calibration to be open. If these conditions are given you can directly apply the clustering (c-button).
If you have a table with calibrated values in the X and Y columns but a Slice column instead of the Z column, you can easily create the Z-column. First open the input image, or if you do not have one, create an empty 16-bit input image, big enough to contain all coordinates and with the correct scales for x,y and z. Then add the Z column by applying a table-macro. On the Results-table select Edit>Apply Macro... and enter the text:
   getVoxelSize(width, height, depth, unit)
   Z = Slice * depth
or run the macro
Table.applyMacro("getVoxelSize(width, height, depth, unit) Z = Slice * depth");
from the macro-editor.
If your data is big, it can be a good idea to sort the table by the values in the Z-column (Results>Sort...).
You can also use the tool if you have a table with 2D-points in the columns X and Y. Open the input image or create an empty image with the spatial scale that corresponds to the data in the table. Create the Z-column by applying a table-macro. On the Results-table select Edit>Apply Macro... and enter the text:
Z = 1
or run the macro
Table.applyMacro("Z = 1");
from the macro-editor.
- 24.06.2022 - the tool now converts the LoG-image to 16-bit before running the 3D maxima finder, otherwise the noise parameter does not seem to work correctly and less nuclei are detected
- 23.02.2022 - fixed a number of incompatibilities with newer ImageJ versions, tested with 1.53o
[1] Ollion, J., Cochennec, J., Loll, F., Escudé, C., and Boudier, T. (2013). TANGO: a generic tool for high-throughput 3D image analysis for studying nuclear organization. Bioinformatics 29, 1840–1841.
[2] Ester, M., Kriegel, H.P., Sander, J., and Xu Xiaowei. A density-based algorithm for discovering clusters in large spatial databases with noise. Proceedings of the Second International Conference on Knowledge Discovery and Data Mining (KDD-96). AAAI Press. pp. 226–231. ISBN 1-57735-004-9


 Volker Bäcker