
Mobile DevTools for Browser & WebView — Eruda Alternative
On-device Mobile DevTools with Live HTML, CSS Editing & Advanced JavaScript Debugging
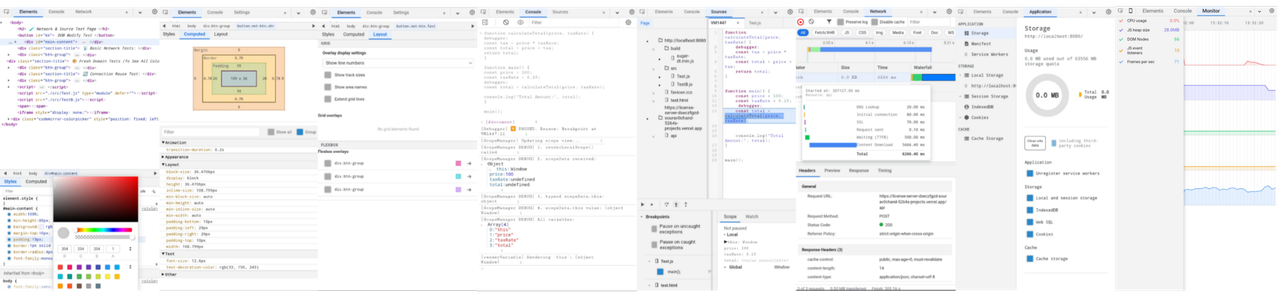
Suger DevTool is a standalone, high-performance mobile-first DevTools designed to bring a desktop-like debugging experience directly to mobile devices.
It focuses on deep inspection and live editing, not just console logging.
Suger DevTool works entirely on-device, without requiring a desktop computer, USB connection, or remote DevTools setup.
It is optimized for:
- Mobile Browsers
- Acode
- WebView-based applications
- Shadow Dom
Most mobile debugging tools focus on basic logging and network inspection.
Suger DevTool is built for developers who need real control and visibility on mobile devices.
- Live HTML tree editing with instant visual feedback
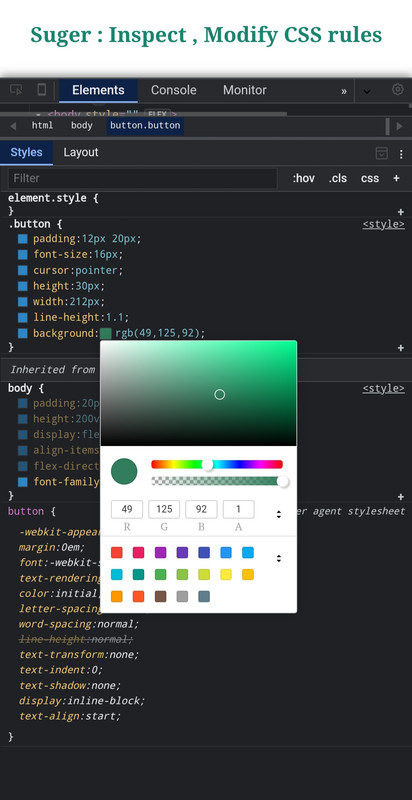
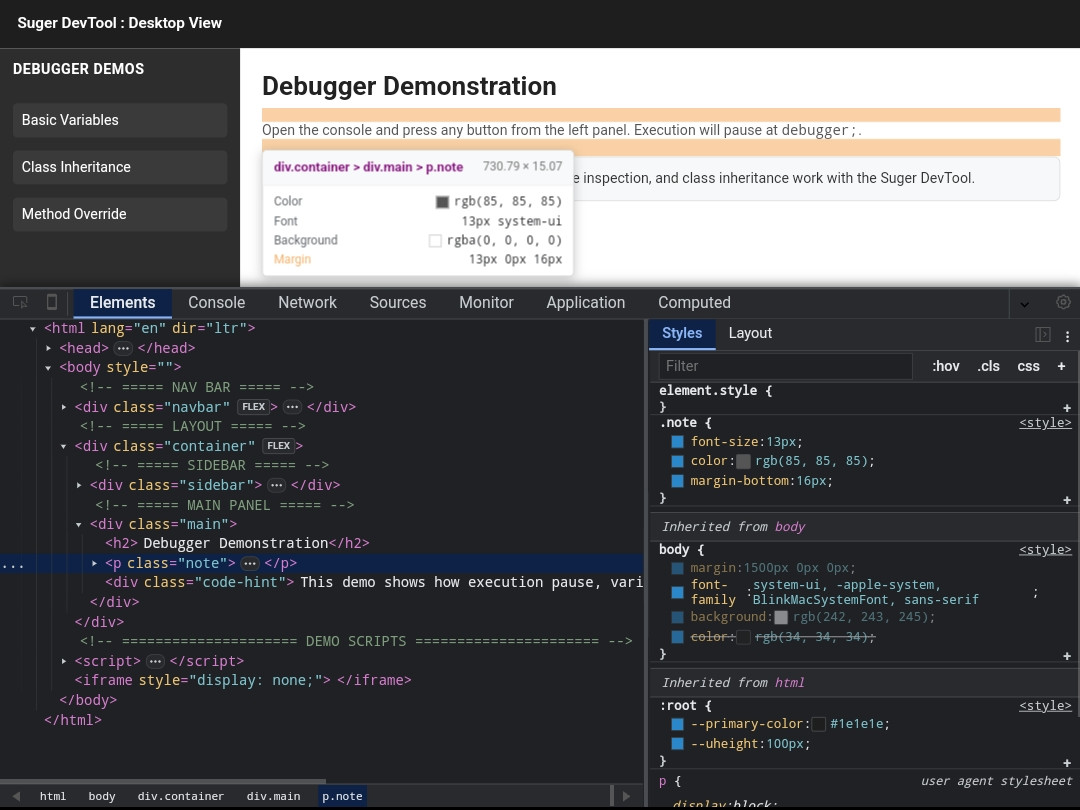
- Full CSS rule editing with integrated color picker
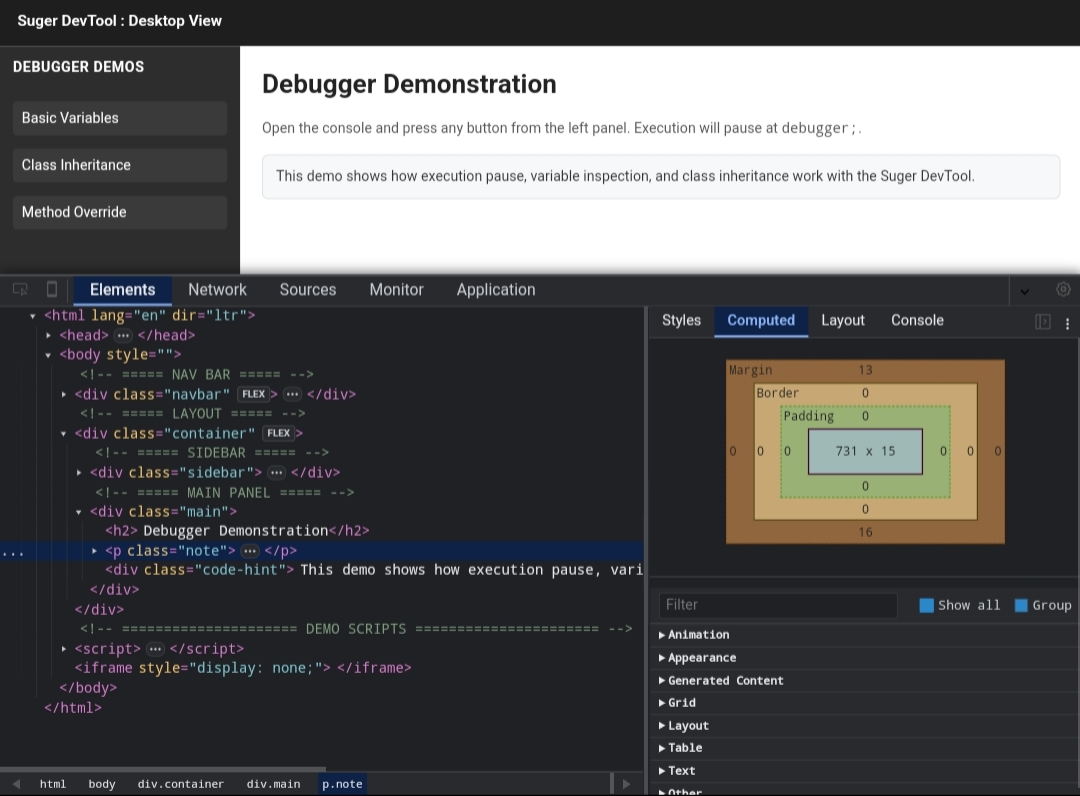
- Computed style inspection and box model view
- Advanced JavaScript debugging with async/await stepping
- Pause JavaScript execution and DOM updates to inspect state
- No desktop, no USB, no remote debugging required
- Mobile-first web developers
- WebView / Hybrid app developers
- Acode users
- QA testers debugging on real devices
- Developers without reliable access to desktop DevTools
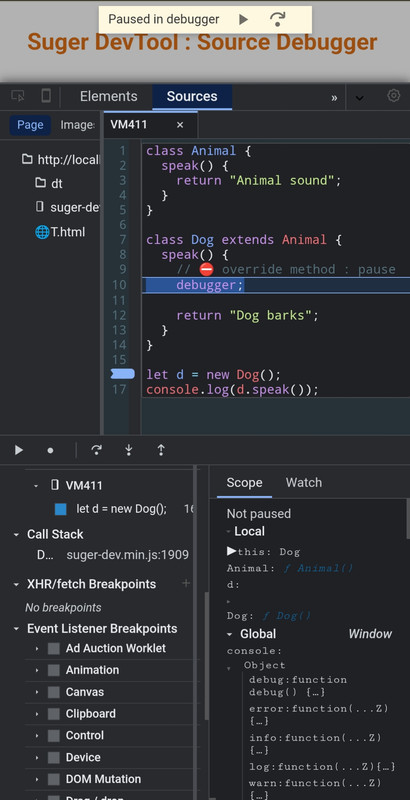
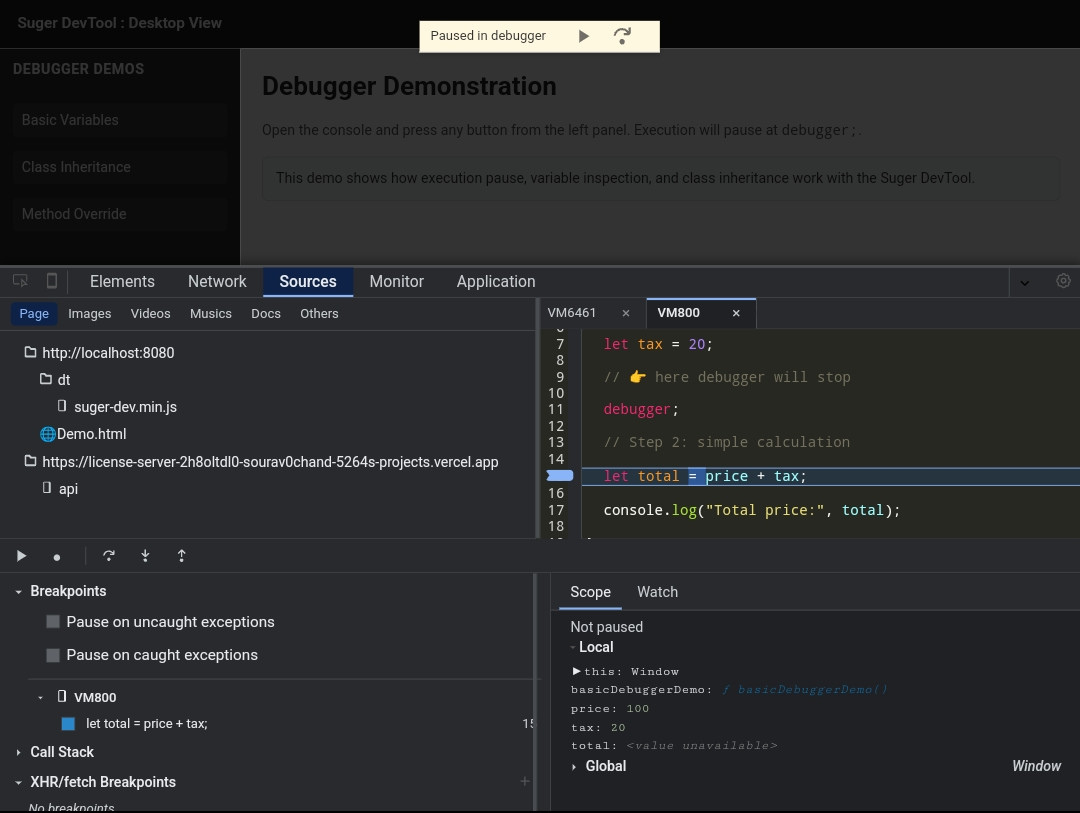
A fully interactive JavaScript debugger designed for mobile environments.
- Async Support — Step through asynchronous code, Promises, event listeners, and timers
- Breakpoints — Set breakpoints in inline scripts and external JavaScript files
- Scope Analysis — Inspect local, closure, block, and global variables in real time
- Watch Expressions — Track expressions and variables as execution progresses
- Execution Control — Pause and resume JavaScript execution safely
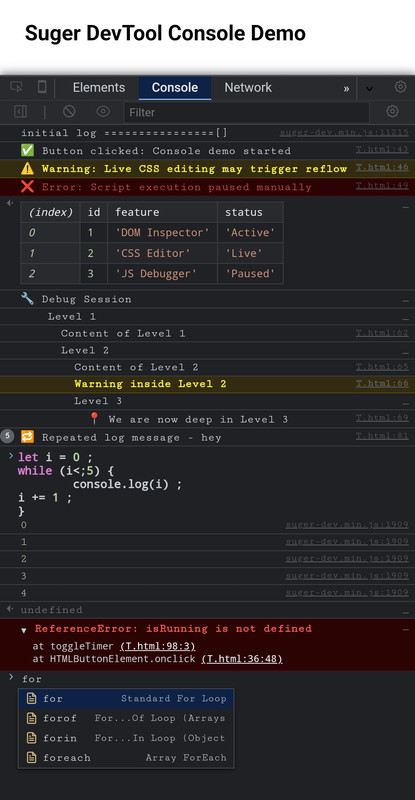
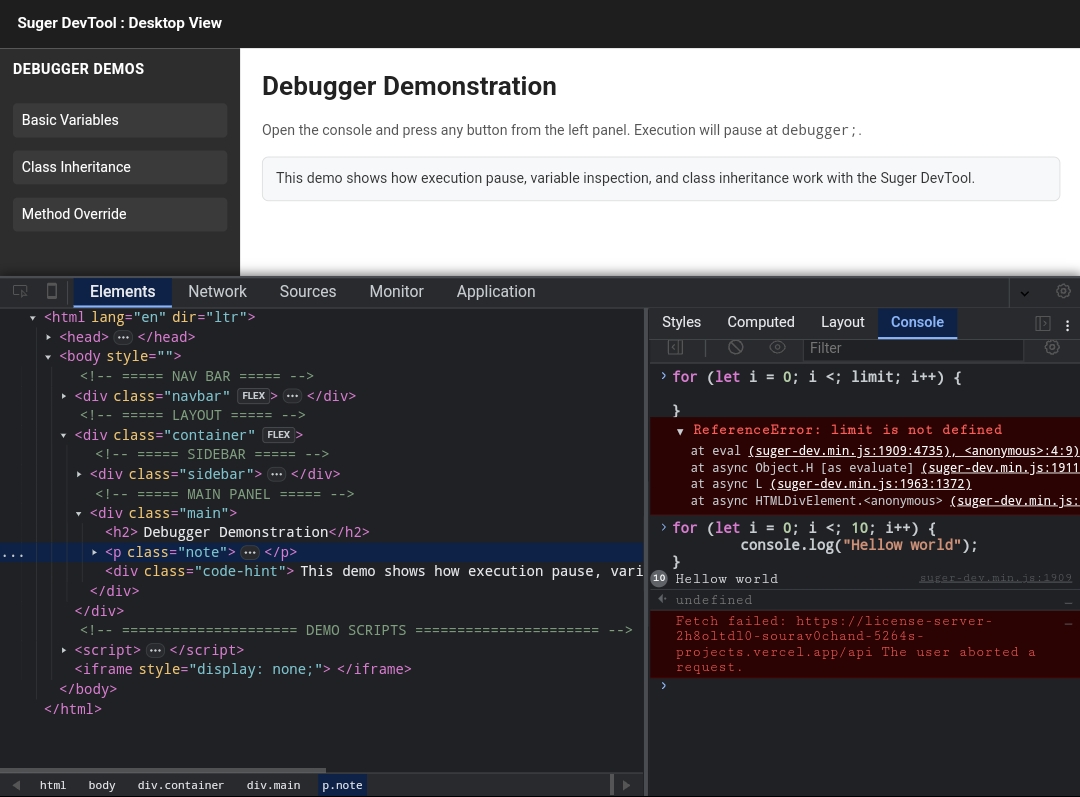
A pro-level, fully interactive JavaScript console tailored for deep inspection and rapid execution.
- Intelligent Autocomplete — Context-aware suggestions for object properties, global variables, JS keywords, and custom snippets.
- Eager Evaluation — Real-time "ghost" preview of expression results before pressing enter.
- Advanced Object Inspector — Chrome-style object evaluation with
[[Prototype]]chain,Symbolsupport, and clickable Getters/Setters(...). - Interactive Stack Traces — Detailed error logs with clickable source links (
file:line:col) that directly route to the exact line in the Source Debugger. - Smart Snippets — Inject pre-built code blocks with interactive tab-stops for quick and repetitive debugging.
- Rich Formatting — Full support for horizontal
console.table, collapsibleconsole.group()with indentation lines, and%cCSS-styled logs. - Early Log Ingestion — Captures all logs, native errors, and unhandled rejections that occur even before the DevTool is fully initialized.
- Smart Context Menu — Advanced copy options including "Copy Object (JSON)", "Copy This Session", and "Copy Input + Outputs" via long-press/right-click.
- Filter & Sidebar — Categorized log filtering (User, Errors, Warnings, Info) with real-time badge counters.

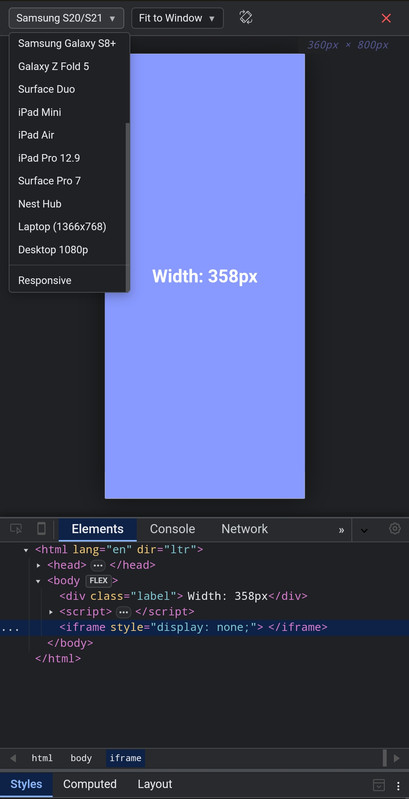
View Responsiveness through device view
- Device View — Device view with many pre exist device & custom
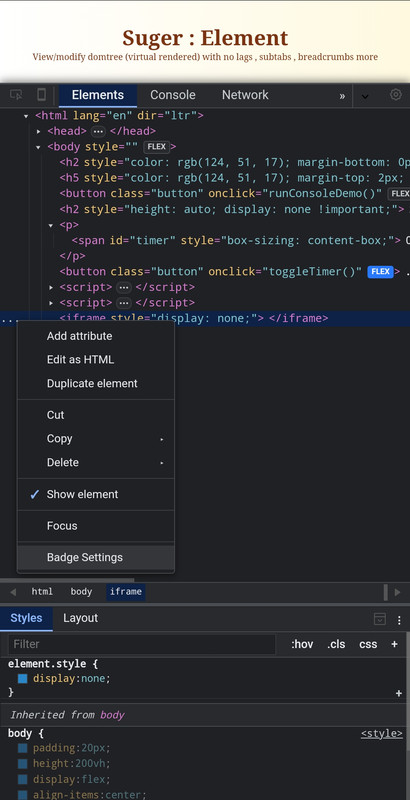
Inspect and modify the DOM directly on your mobile device.
- DOM Tree — Fully interactive DOM tree with expand/collapse
- Live Edit — Edit tags, attributes, and text content in real time
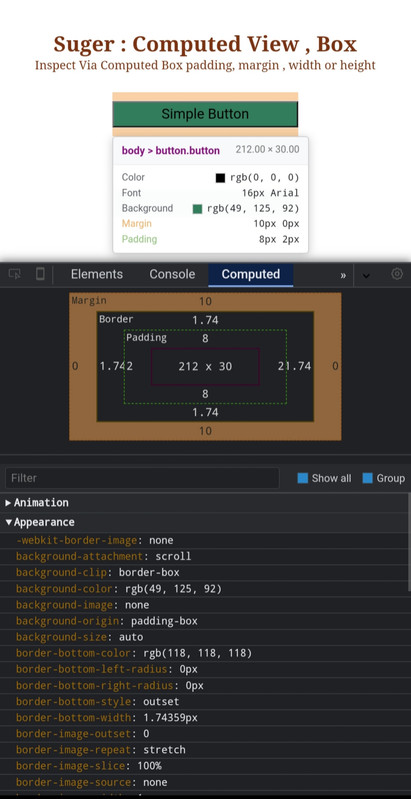
- Computed Styles — Inspect resolved CSS values and box model
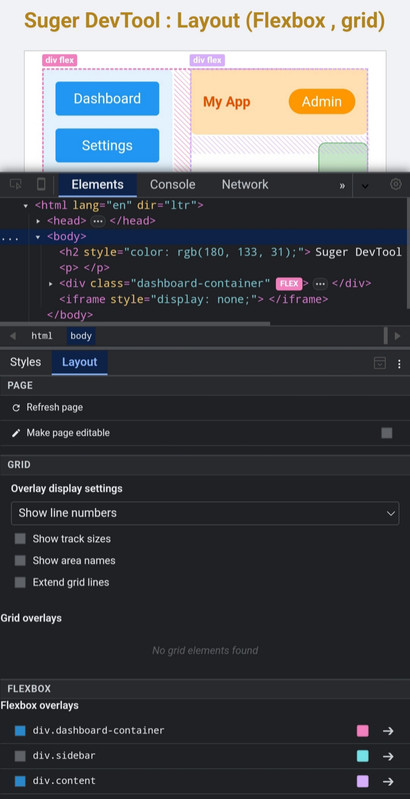
- Layout Tools — Grid and Flexbox visualization overlays
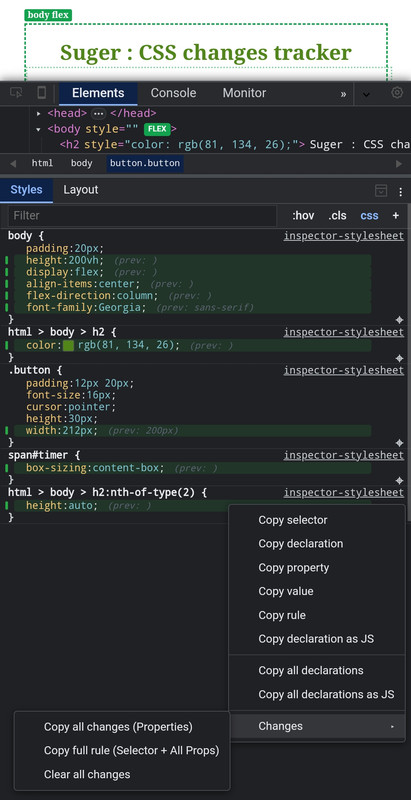
- Style Change Tracker — Track, preview, diff, and copy CSS modifications in real time

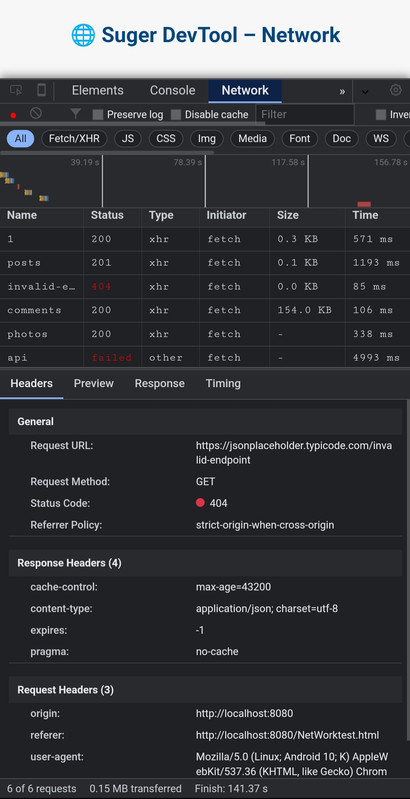
Granular analysis of network traffic and API calls.
- Waterfall Chart — Visual request timing (DNS, SSL, TTFB, Download)
- Interception — Inspect request headers, payloads, and responses
- XHR Breakpoints — Pause execution on specific network requests

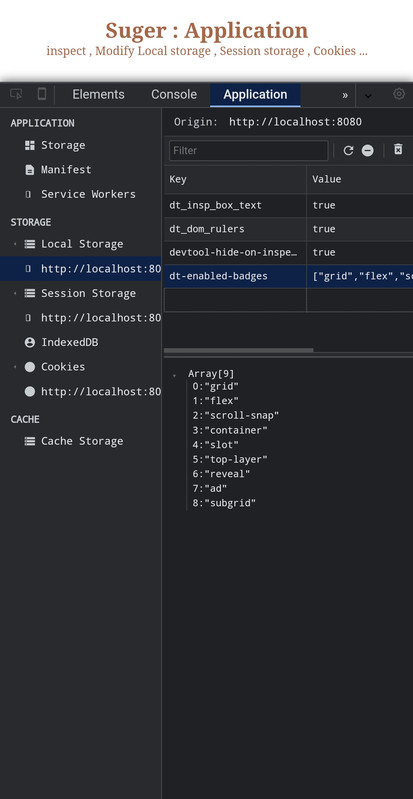
Inspect application-level storage and resources.
- Storage — LocalStorage, SessionStorage, and Cookies viewer
- Deep Inspect — IndexedDB and Cache Storage explorer
- Service Workers — Inspect and unregister service workers
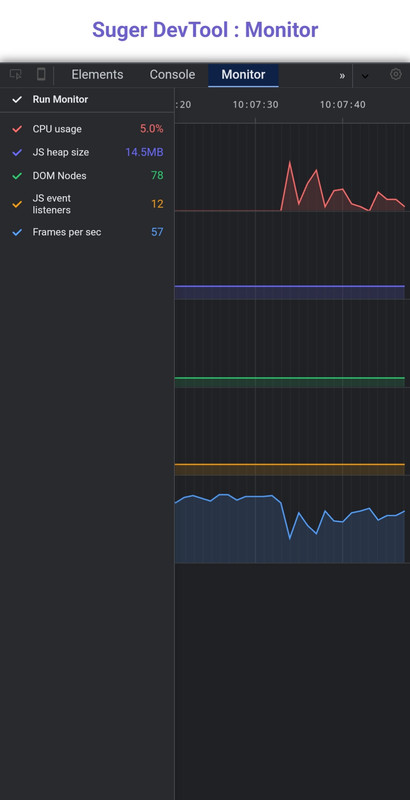
Real-time tracking of system resources and rendering performance.
- Resource Graphs — Visual timeline for CPU usage, JS Heap, and FPS
- DOM Stats — Monitor DOM node counts and active event listeners

Different tools are built for different needs.
| Feature | Suger DevTool | Eruda | vConsole |
|---|---|---|---|
| Tablet/Mobile Support | ✅ | ✅ | ✅ |
| Chrome Bookmarklet Support | ✅ | ✅ | ✅ |
| Inspect Html | ✅ | ✅ | ❌ |
| Box model preview | ✅ | ✅ | ❌ |
| Performance Monitor | ✅ | ✅ | ❌ |
| Console with Snippet/Eager View | ✅ | ❌ | ❌ |
| Live HTML editing | ✅ | ❌ | ❌ |
| CSS rule editing | ✅ | ❌ | ❌ |
| Color picker | ✅ | ❌ | ❌ |
| Devices Preview | ✅ | ❌ | ❌ |
| Advanced JS debugging | ✅ | ❌ | ❌ |
| Network waterfall (DNS, SSL, TTFB) | ✅ | ❌ | ❌ |
| Computed styles depth | ✅ Detailed | Basic | ❌ |
| UI language support | ✅ Structured/Extensible | Limited | Limited |
| Extension? | Upcoming | ✅ | Limited |
| Desktop required | No | No | No |
| Min Size | ~2.7MB | ~480KB | ~280KB |
| Lag? | No | No | No |
| Target use case | Deep inspection | Lightweight debug | Logging & network |
You can use Suger DevTool in any HTML/JavaScript project.
Required for advanced debugging features such as network interception and source debugging.
- File name:
devtool-sw.js - Location: Project root (same directory as
index.html)
⚠️ Make sure the service worker file is accessible from the root scope.
Download or serve the engine locally:
- File:
suger-dev.js
Add before </body>:
<script src="dt/suger-dev.js"></script>File structure:
Your_Project/
├── dt/
│   └── suger-dev.js
├── devtool-sw.js
└── index.html          <- add <script> here
Inject Suger Dev Tool via CDN:
suger CDN link - 1.x.xv
<script src="https://suger-cdn.vercel.app/suger-dev.js"></script>File structure:
Your_Project/
├── devtool-sw.js
└── index.html           <- add <script> here
You can use Suger DevTool on almost any website without modifying its source code. Save the following as a bookmark URL:
javascript:(function(){
  var script = document.createElement('script');
  script.src = 'https://suger-cdn.vercel.app/suger-dev.min.js?key=SUGER-ACCESS-KEY';
  document.body.appendChild(script);
})();
Only No required Gmail
access keysupports
javascript:(function(){
  var script = document.createElement('script');
  script.src = 'https://suger-cdn.vercel.app/suger-dev.min.js';
  document.body.appendChild(script);
})();javascript:(function(){
var script = document.createElement('script');
script.src = 'http://localhost:8080/build/suger-dev.min.js';
document.body.appendChild(script);
})();Suger DevTool now brings Native React Fiber Inspection directly to your mobile device! You no longer need a desktop to debug React component trees, track performance bottlenecks, or modify live states.
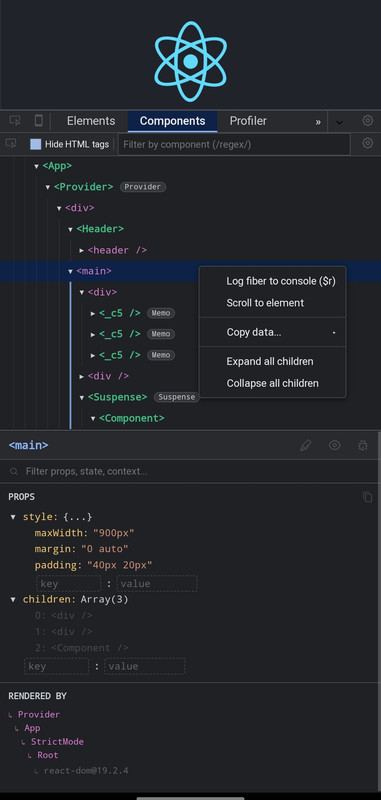
- Component Tree: Deeply inspect your React hierarchy with VS Code-style indentation guides, smart naming, and dynamic badges (
Memo,Provider,Suspense,ForwardRef). - Live Editor: Modify
Props,State,Context, andHookson the fly with a dedicated inspector panel and intelligent autocomplete. - Advanced Profiler: Record render sessions and view them via Flamegraph or Ranked charts. Includes a detailed "Why did this render?" analysis (e.g., Props changed, Hooks changed).
- Advanced Context Menus: Long-press (or right-click) any component or prop to log it directly to the console (
$r,$tmp), copy its JSON, or recursively expand/collapse massive trees.
Because React initializes its DevTools hook the moment the page loads, Bookmarklets will NOT work for React debugging (as the script injects too late).
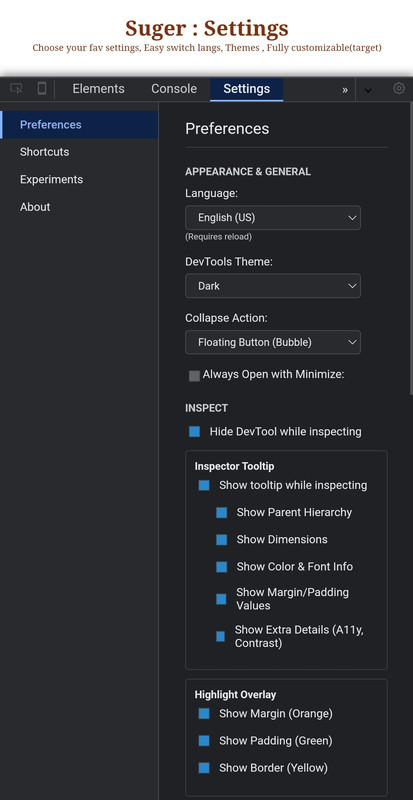
Don't Forget to Enable React Development from Experiment tab
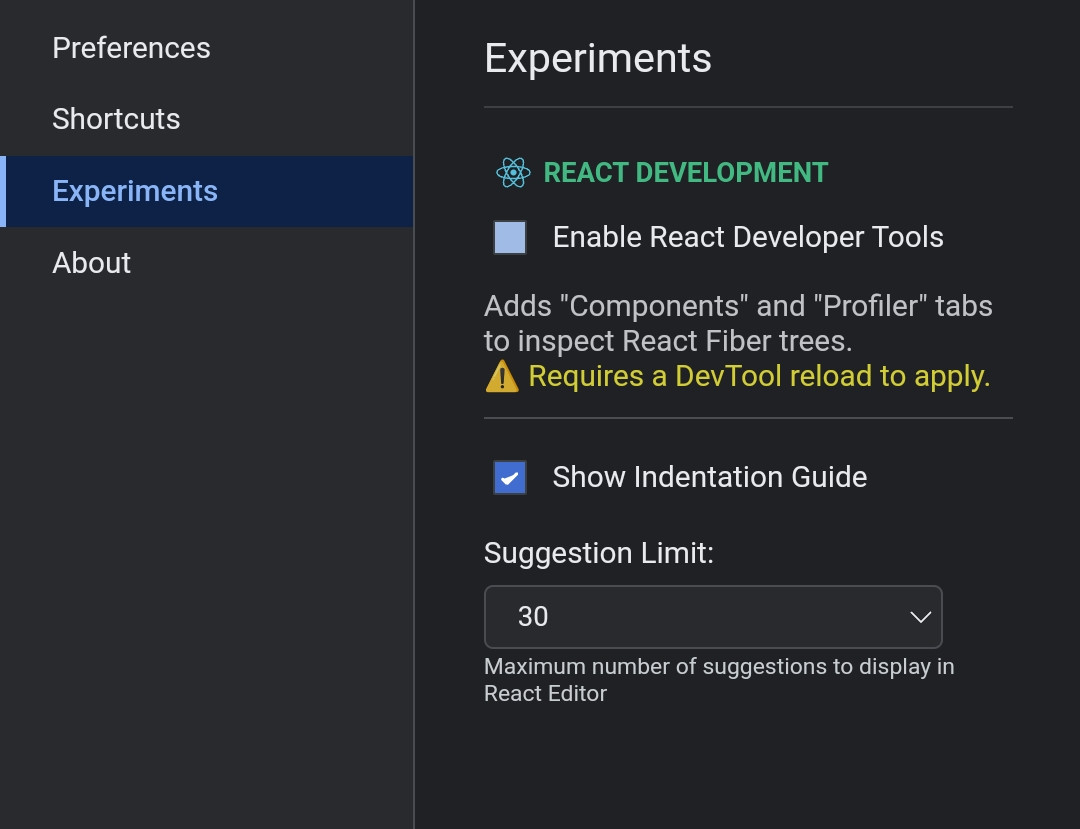
To use the React features, you must inject Suger DevTool before React loads into the DOM.
Method 1: Direct HTML Injection (Recommended for Testing)
Place the Suger DevTool script at the very top of your <head> tag in your index.html :
<!DOCTYPE html>
<html lang="en">
  <head>
    <meta charset="utf-8" />
    <title>My React App</title>

    <script src="https://suger-cdn.vercel.app/suger-dev.min.js?key=NYAR-FREE-GIFT-SUGR"></script>

  </head>
  <body>
    <div id="root"></div>
    </body>
</html>Suger DevTool is currently in Public Beta. We are providing free access to the community to gather feedback and stress-test the engine.
NYAR-FREE-GIFT-SUGR
SUGER-ACCESS-KEY
This tool was originally built for personal mobile development workflow. As it opens to public beta, the key system helps to:
- Track Usage – Monitor concurrent users testing the tool
- Resource Management – Prevent CDN and Playground overload
- Feedback Loop – Connect with active testers to improve the debugger
-
Usage The beta key grants full access to all features for testing and development purposes.
-
Privacy No browsing data or inspected code is tracked. The key only validates your session.
-
Liability This is beta software. Avoid using it in critical production environments.
-
Fair Use Do not bypass the activation system or redistribute the minified engine without proper credit.
- Current Status: Public Beta (Minified Engine)
- Final Goal: Fully open-source release after stabilization and proper documentation
-
Telegram Support @cosmodec
-
Feedback Found a bug or have a feature request? Open an issue on GitHub or contact via Telegram