-
Notifications
You must be signed in to change notification settings - Fork 3
Saturation


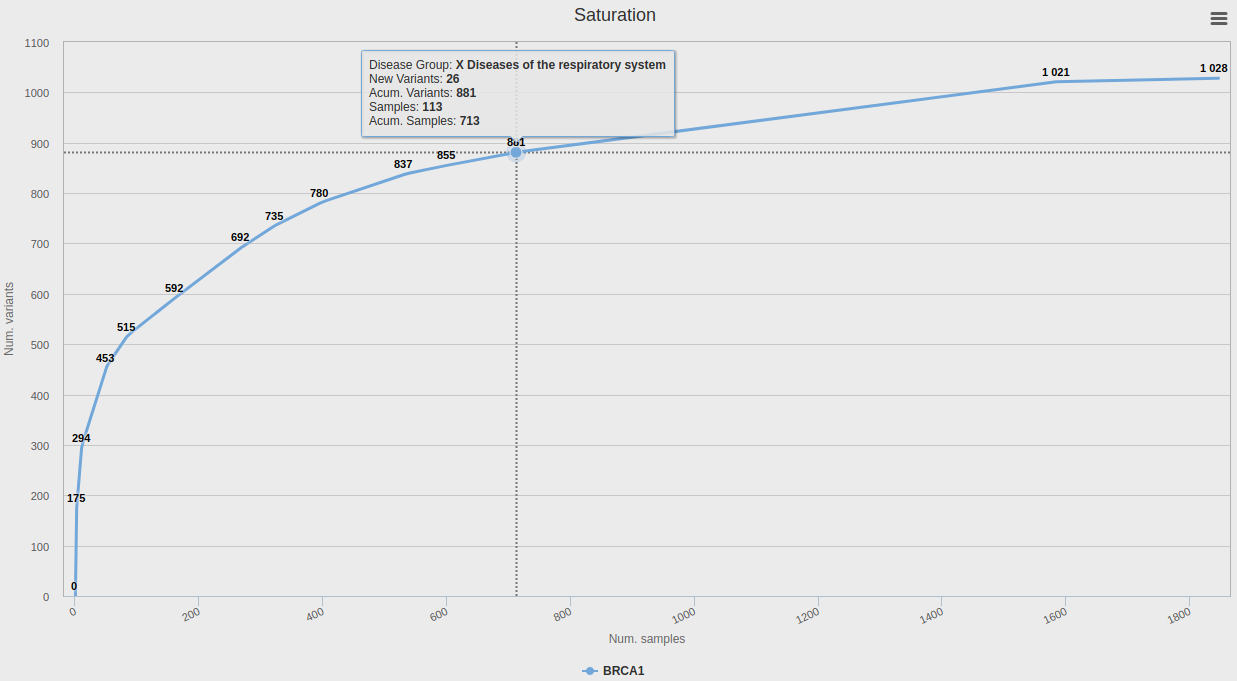
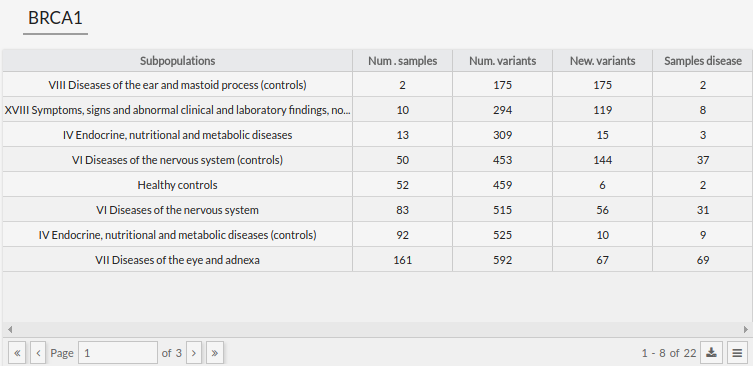
In the saturation tab, the user can see the variants of each subpopulation for a search performed by region or gene.
When you place the mouse over a node, an information box is displayed. This box shows the name of the disease, the new variants found in the last data insertion of that group in the database, the total variants that there are and finally the number of samples associated with that subpopulation.
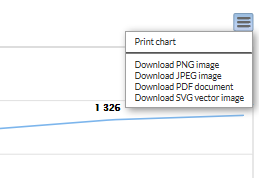
This graphic can be downloaded in the same way as the images in the stats tab. By placing the button with three stripes on the top right side of the graphic it shows you the options to print or download in the png, jpeg, PDF or SVG formats.

Table of contents:
-
1.1 CSVS structure
-
2.1 Beacon
-
3.1 Filters
3.2 Results
-
4.1 Variants and samples per disease