-
Notifications
You must be signed in to change notification settings - Fork 3
Search
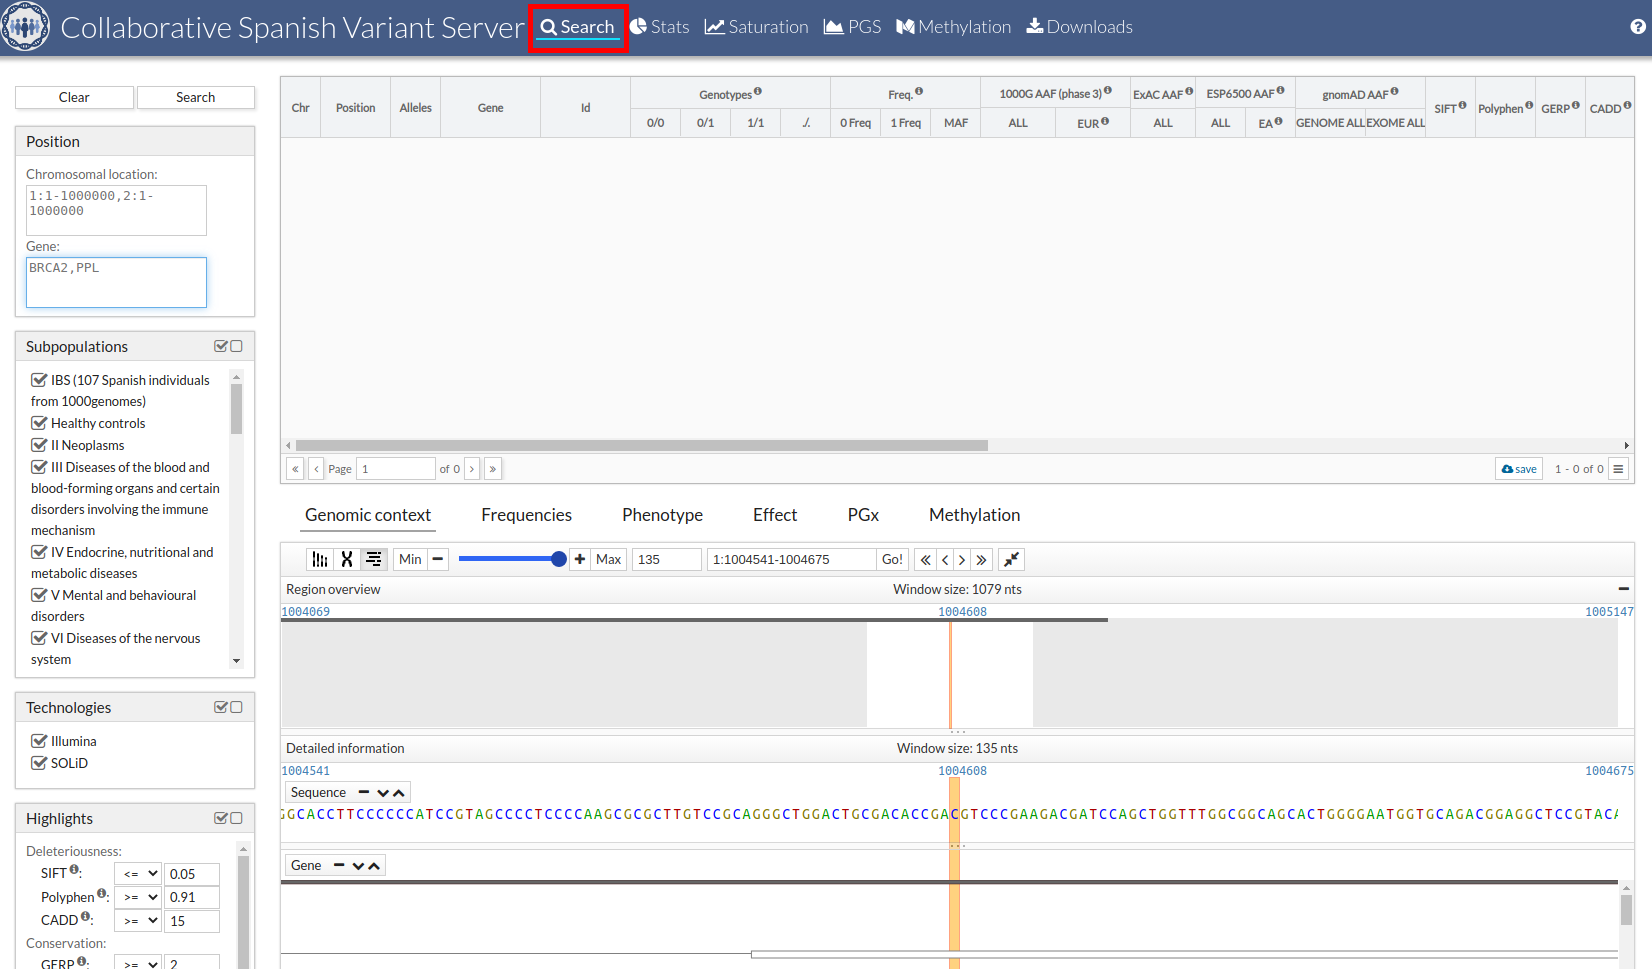
The CSVS tool provides various search filters (left column).
-
Position:
This filters is required and have two possibilities:
- Chromosomal Location: Region where narrow your search. Chromosome:Start-End. Ex.: 1:10004570-10046460.
- Gene: Visualize a particular gene. If you want see more than one gene, separate them with commas. Ex.: BRCA2,FAT3. The maximum number of genes you accept is 5.
You must indicate a search region y/or a gene to Search.
-
Subpopulations:
Use ICD-10 (10th revision of the International Statistical Classification of Diseases and Related Health Problems), and other projects groups: MGP (Medical Genome Proyect) or IBIS (107 Spanish individuals from 1000 Genomes Project).
- IBS (107 Spanish individuals from 1000genomes)
- Healthy controls
- I Certain infectious and parasitic diseases
- II Neoplasms
- III Diseases of the blood and blood-forming organs and certain disorders involving the immune mechanism
- IV Endocrine, nutritional and metabolic diseases
- V Mental and behavioural disorders
- VI Diseases of the nervous system
- VII Diseases of the eye and adnexa
- VIII Diseases of the ear and mastoid process
- IX Diseases of the circulatory system
- X Diseases of the respiratory system
- XI Diseases of the digestive system
- XII Diseases of the skin and subcutaneous tissue
- XIII Diseases of the musculoskeletal system and connective tissue
- XIV Diseases of the genitourinary system
- XV Pregnancy, childbirth and the puerperium
- XVI Certain conditions originating in the perinatal period
- XVII Congenital malformations, deformations and chromosomal abnormalities
- XVIII Symptoms, signs and abnormal clinical and laboratory findings, not elsewhere classified
- XIX Injury, poisoning and certain other consequences of external causes
- XX External causes of morbidity and mortality
- XXI Factors influencing health status and contact with health services
- XXII Codes for special purposes
- MGP (267 healthy controls)
- MGP (healthy controls, Solid 4)
In addition, new groups have been added and these correspond to parents of people in that group, but NOTE: they do not seem like this disease, nevertheless you can not discard they are carrier for pathogenic variants in the case of recessive diseases.
- I Certain infectious and parasitic diseases (controls)
- II Neoplasms (controls)
- III Diseases of the blood and blood-forming organs and certain disorders involving the immune mechanism (controls)
- IV Endocrine, nutritional and metabolic diseases (controls)
- V Mental and behavioural disorders (controls):
- VI Diseases of the nervous system (controls)
- VII Diseases of the eye and adnexa (controls)
- VIII Diseases of the ear and mastoid process (controls)
- IX Diseases of the circulatory system (controls)
- X Diseases of the respiratory system (controls)
- XI Diseases of the digestive system (controls)
- XII Diseases of the skin and subcutaneous tissue (controls)
- XIII Diseases of the musculoskeletal system and connective tissue (controls)
- XIV Diseases of the genitourinary system (controls)
- XV Pregnancy, childbirth and the puerperium (controls)
- XVI Certain conditions originating in the perinatal period (controls)
- XVII Congenital malformations, deformations and chromosomal abnormalities (controls)
- XVIII Symptoms, signs and abnormal clinical and laboratory findings, not elsewhere classified (controls)
- XIX Injury, poisoning and certain other consequences of external causes (controls)
- XX External causes of morbidity and mortality (controls)
- XXI Factors influencing health status and contact with health services (controls)
- XXII Codes for special purposes (controls)
The subpopulation is displayed if there is data.
If you do not select any subpopulation in the search, this filter will not be used, so all the subpopulation will be used.
-
Technologies: CSVS has data from different sequencing technologies:
- Illumina
- SOLiD
If you wish, you can filter by Illumina or SOLiD. If you do not select any technology in the search, this filter will not be used, so all the technology will be used.
-
Highlights: You can color the results (no filter) of SIFT, Polyphen, CADD, GERP or consequence type selected SO terms.
-
SIFT score predicts whether an amino acid substitution affects protein function. SIFT value less than 0.05 represents a 'deleterious' prediction. SIFT value greater than or equal to 0.05 represents a 'tolerated' prediction.
Allowed values are between '0' and '1'.

-
Polyphen score predicts the possible impact of an aninoacid subsitution on the structure and function of a protein. Polyphen scores can be benign (<0.446), possibly damaging (0.446-0.908) or probably damaging (>0.908).
Allowed values are between '0' and '1'.

-
CADD tool scores the deleteriousness of snvs and indels. Higher values indicate more likely to have deleterious effects.

-
GERP score estimates the level of conservation of positions. Positive scores represents a substitution deficit and this indicate that a site may be under evolutionary constraint. Negative scores indicate that a site is probably evolving neutrally. Some author suggest that scores >=2 indicate evolutionary constraint and >=3 indicate purifying selection.
Allowed values are between '-15' and '7'.

-
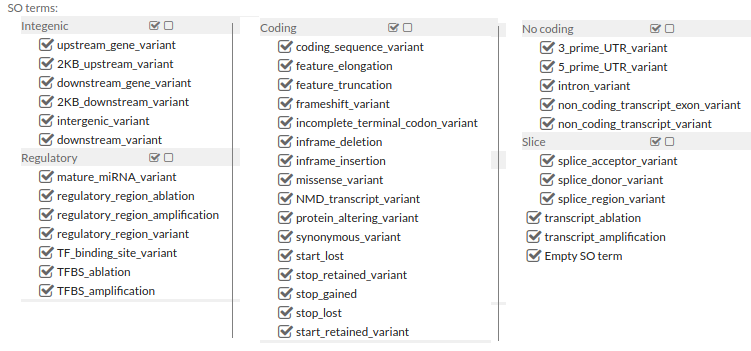
Sequence Ontology (SO) terms for the variation consequences
-
An example from the use:

NOTE: When there are several Consequence types, the worst one is selected according to cellbase. To see all, select the variants and click on the Effect tab.
When the user selects the desired filters, he must press to search to perform the search.The search result will be displayed in a data table. The table shows the variants of the CSVS database enriched with other annotations from Cellbase.
Cellbase is a database that integrates the most relevant biological information about genomic features and proteins, gene expression regulation, functional annotation, genomic variation and systems biology. Cellbase use the most relevant repositories such as Ensembl, Uniprot, Clinvar, COSMIC or IntAct among many others. For more information about cellbase click here.
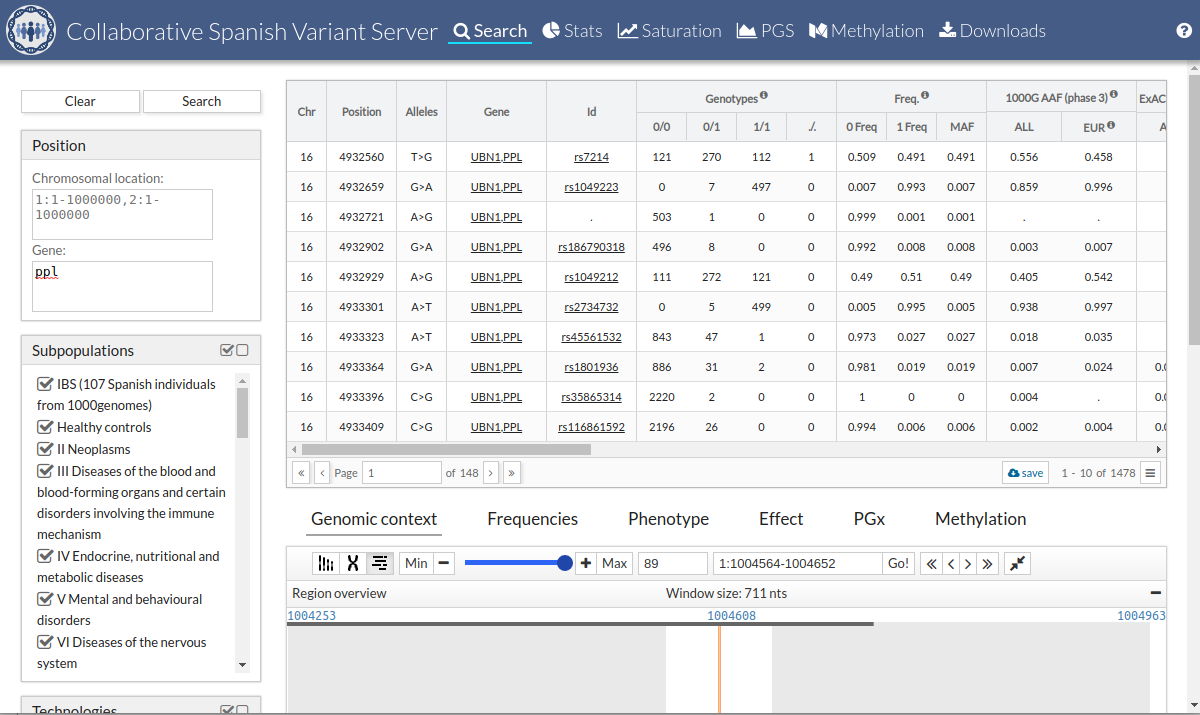
The information shown would be the following:
-
Chr: Chromosome position.
-
Position: Variant position.
-
Alleles: Alleles of the variant.
-
Gene: Gene or genes in which the variant is located o related.
-
Id: Identifier of the variant.
-
Genotype: Genotype counts:
- 0/0: homozygous reference
- 0/1: heterozygous
- 1/1: homozygous alterntive
- ./.: missing
-
Freq.: Allele Frequency:
- 0 Freq: allele frequency for reference
- 1 Freq: allele frequency for alternative
- MAF: Minor Allele Frequency, the lowest value between 0 Freq and 1 Freq
-
1000G AAF(phase 3): Alternate Allele Frequency in 1000 genomes project database (phase 3)
- ALL: Frequency recorded in 1000G for the variant selected for the entire population.
- EUR: Frequency recorded in 1000G for the variant selected for the European population.
-
ExAC AAF: Alternate Allele Frequency in Exome Aggregation Consortium (ExAC) database
- ALL: Frequency recorded in ExAC database for the variant for the entire population.
-
ESP 6500 AAF: Alternate Allele Frequency in Exome Sequencing Project (ESP) database
- ALL: Frequency recorded in ESP 6500 database for the variant for the entire population.
- EA: Frecuency recorded in ESP6500 database for the variant for European Amerindian.
-
gnomAD AAF: Alternate Allele Frequency in Genome Aggregation Database (gnomAD).
- GENOME ALL: Frequency recorded in gnomAD database for the variant for the entire population (genome).
- EXOME ALL: Frecuency recorded in gnomAD database for the variant for the entire population (exome).
-
SIFT: SIFT score predicts whether an amino acid substitution affects protein function. SIFT value less than 0.05 represents a 'deleterious' prediction. SIFT value greater than or equal to 0.05 represents a 'tolerated' prediction
-
Polyphen: Polyphen score predicts the possible impact of an aninoacid subsitution on the structure and function of a protein. Polyphen scores can be benign (<0.446), possibly damaging (0.446-0.908) or probably damaging (>0.908).
-
phastCons: phastCons scores represent probabilities of negative selection and range between 0 and 1
-
phyloP: phyloP scores measure the level of conservation of positions. Positive scores measure conservation whereas negative scores measure acceleration.
-
GERP: GERP score estimates the level of conservation of positions. Positive scores represents a substitution deficit and this indicate that a site may be under evolutionary constraint. Negative scores indicate that a site is probably evolving neutrally. Some author suggest that scores >=2 indicate evolutionary constraint and >=3 indicate purifying selection.
-
CADD: CADD tool scores the deleteriousness of snvs and indels. Higher values indicate more likely to have deleterious effects
-
Consequence type: Worst consequence type found among all transcripts by Cellbase. We also collect this information from the Cellbase database that is annotated with ensembl. You can find the information about the calculation of the consequence type of ensembl here.
-
Phenotypes: Information about relationships among human variations and Clinvar and Cosmic databases.
- Clinvar: Clinvar is a public archive of reports of the relationships among human variations and phenotypes hosted by the National Center for Biotechnology Information (NCBI) and funded by intramural National Institutes of Health (NIH) funding. In this column we note the phenotype of the variant that appears in Clinvar.
- Cosmic: Catalogue Of Somatic Mutations In Cancer (COSMIC), is the world's largest and most comprehensive resource for exploring the impact of somatic mutations in human cancer.In this column we note the phenotype of the variant that appears in Cosmic.
-
Pharmacogenomic: Informacion about haplotype associated with the variant. Shows only match with Ref>Ref and Ref>Alt. View extra information in Pharmacogenomic

-
Secondary finding: CSVS database has been interrogated in the search of secondary finding variants following the ACMG recommendations. Pathogenic or likely pathogenic variants according to ClinVar (version database to date October 27, 2022) or ACMG classification obtained with InterVar software were determined in a list of 78 actionable genes (ACMG v3.1, https://doi.org/10.1016/j.gim.2022.04.006).
For these variants, phenotype and OMIM disorder related with the gene are indicated in the “Secondary Findings” field, as well as the inheritance model for the disease (AD, autosomal dominant; AR, autosomal recessive; SD, semidominant; XL, X-linked). External link to the OMIM disorder is available if you click on the text (see documentation for more information).
In order to explore the frequency or prevalence of a certain variant as secondary finding, be aware of the following: CSVS not only contains variants from healthy individuals, but also from affected individuals by diverse pathologies, therefore, in order not to include likely diagnostic variants as secondary findings, affected subpopulations with a related phenotype have to be discarded from the search.

-
Methylation: Information about methylation statistics associated with the location of the variant (chromosomal position).
- Samples/All:
- samples: Number of samples that contain methylation position and that meet the filters (subpopulation) in this position.
- all: Number of all samples that contain methylation position (without filters).
- Avg: Average
- stdDesv: Standard deviation
When you click on the row, you can see additional methylation information in the bottom area.
If you need apply more filters about methylation position, go to tab "Methylation".

- Samples/All:
-
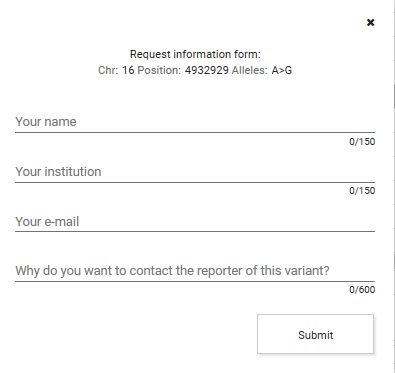
Contact request: Send a request to the reporter of this variant. Click
 and complete the form.
-
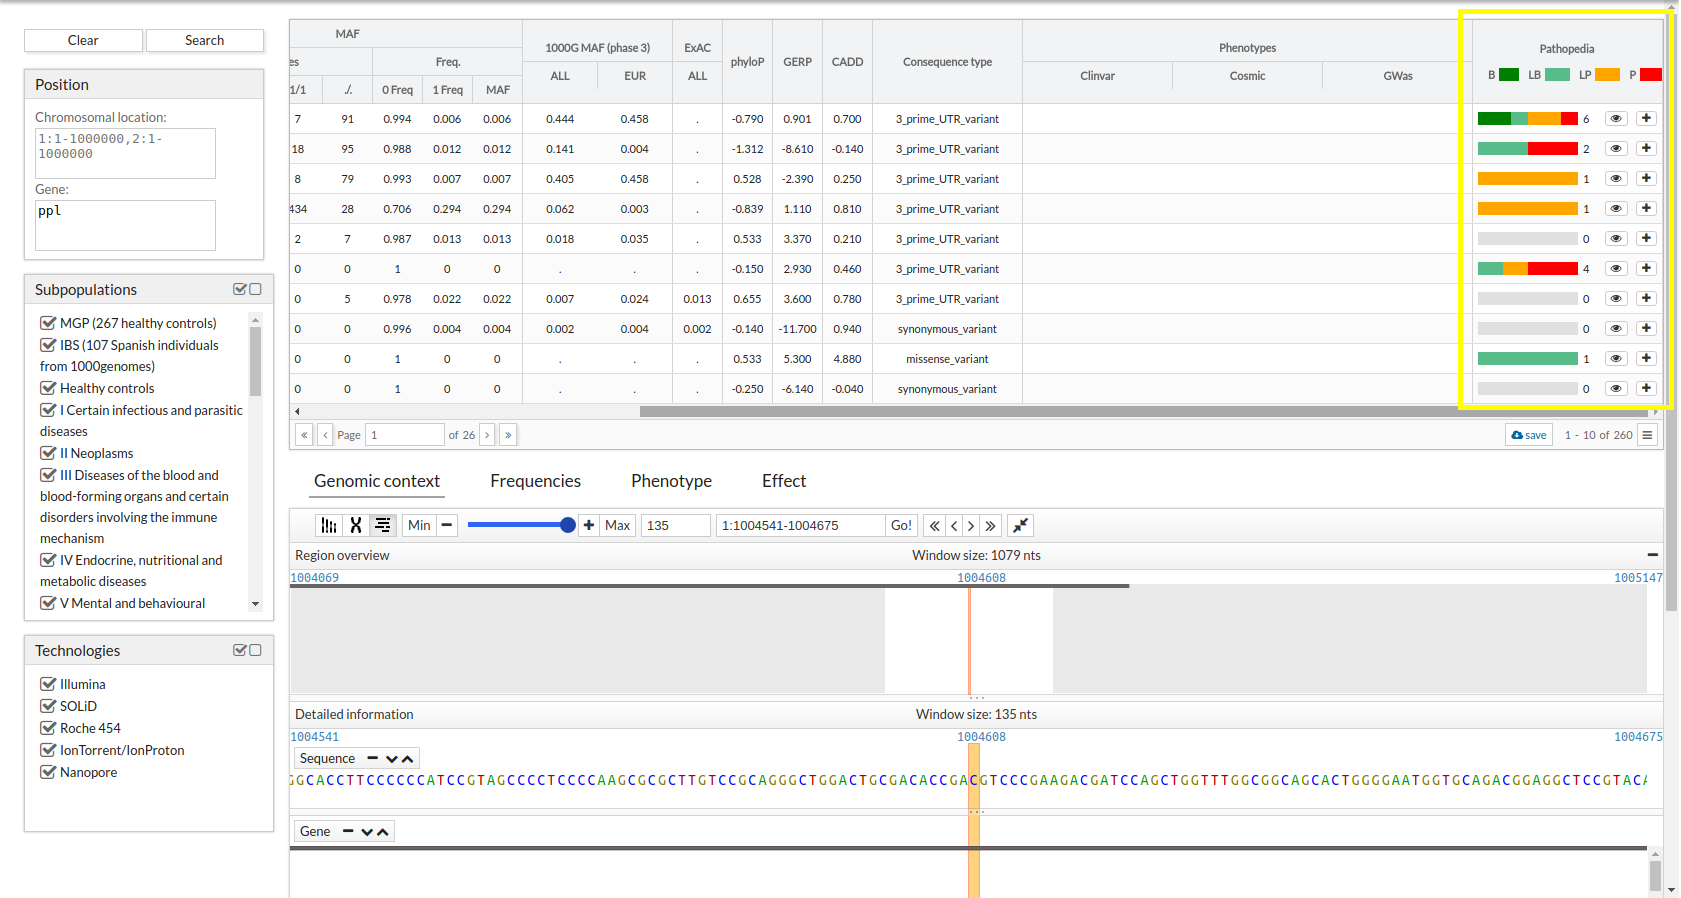
Pathopedia: clinical significance's wiki.
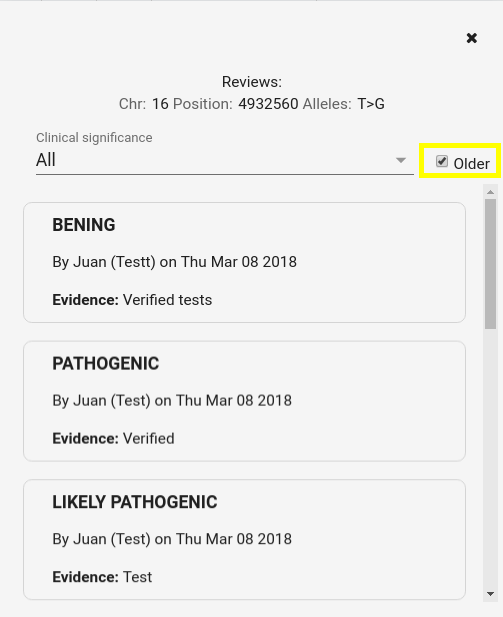
CSVS users can add reviews about the clinical significance of a variant.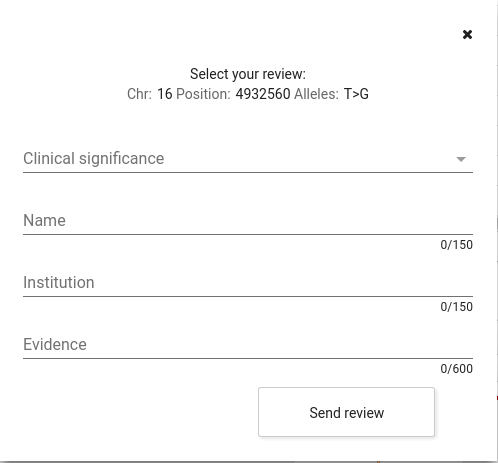
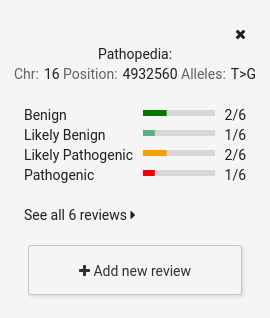
A graph with the contributions already published will be displayed.
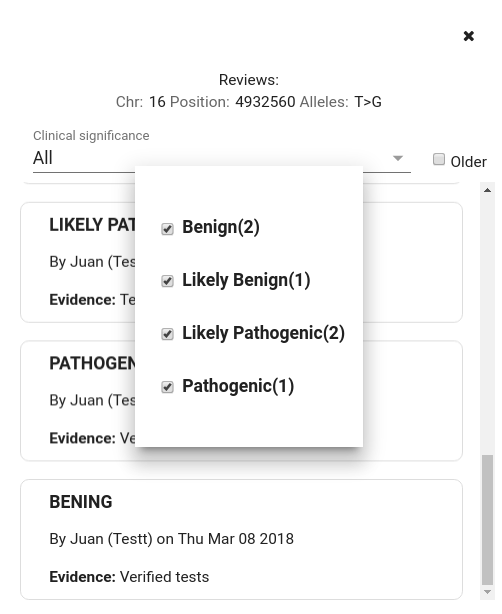
There is the option of viewing all comments, filtering them by clinical significance and ordering them by creation date in the system (by default, the last created ones are displayed)
-
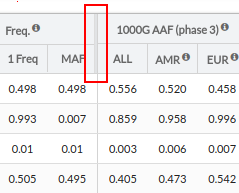
Resize: The size of the columns in the table is modifiable. If the user wants to make the width of a column smaller or bigger, just place the mouse on the edge of the column header that you want to modify until the icon of the two arrows appears, press the mouse and move towards the right or to the left becomes larger or smaller respectively.
-
Pagination: The table shows the results in page form, that is, it shows the first ten results, and to see the next ones we must press the bottom button of the table ">" or move with the wheel of our mouse down on the table. To see the previous results, press the lower button "<" or move with the mouse wheel up. If you click on the ">>" button, the results of the last page will be shown, in the same way if you press "<<" the results of the first page will be shown. It is also possible to directly access a page by entering the desired number in the lower input of the table.

-
Show/Hidden columns: The information in the table can be filtered. If we press the button with the three stripes that is in the lower right part of the table, a drop-down is shown with all the columns of the table. Marking or unchecking the columns will be displayed or not in the table.

-
Save data: By clicking on the save button at the bottom of the table, we will download the search. What we will obtain is a tabular file with the name of the variants and the maf of the CSVS, both genotypes and their frequency. Only get the data show in the screen (max 10 registers). If you need more data, you go to Download tab

-
Copy to clipboard: If the user double-clicks a row, the information will be copied to the clipboard. To make use of the copied information use "paste" (for example: CONTROL+V, right click and paste ...)
The clipboard icon will be hidden after 2 seconds.
The Information copied is different according to the table:
- Variants: "chromosome: reference position>alternative". Example: 16:4932902 G>A

- Methylation: "chromosome:position". Example: 1:999724

- Variants: "chromosome: reference position>alternative". Example: 16:4932902 G>A
If the user clicks on one of the variants shown, the user will be able to see in the lower part some extra information about it.
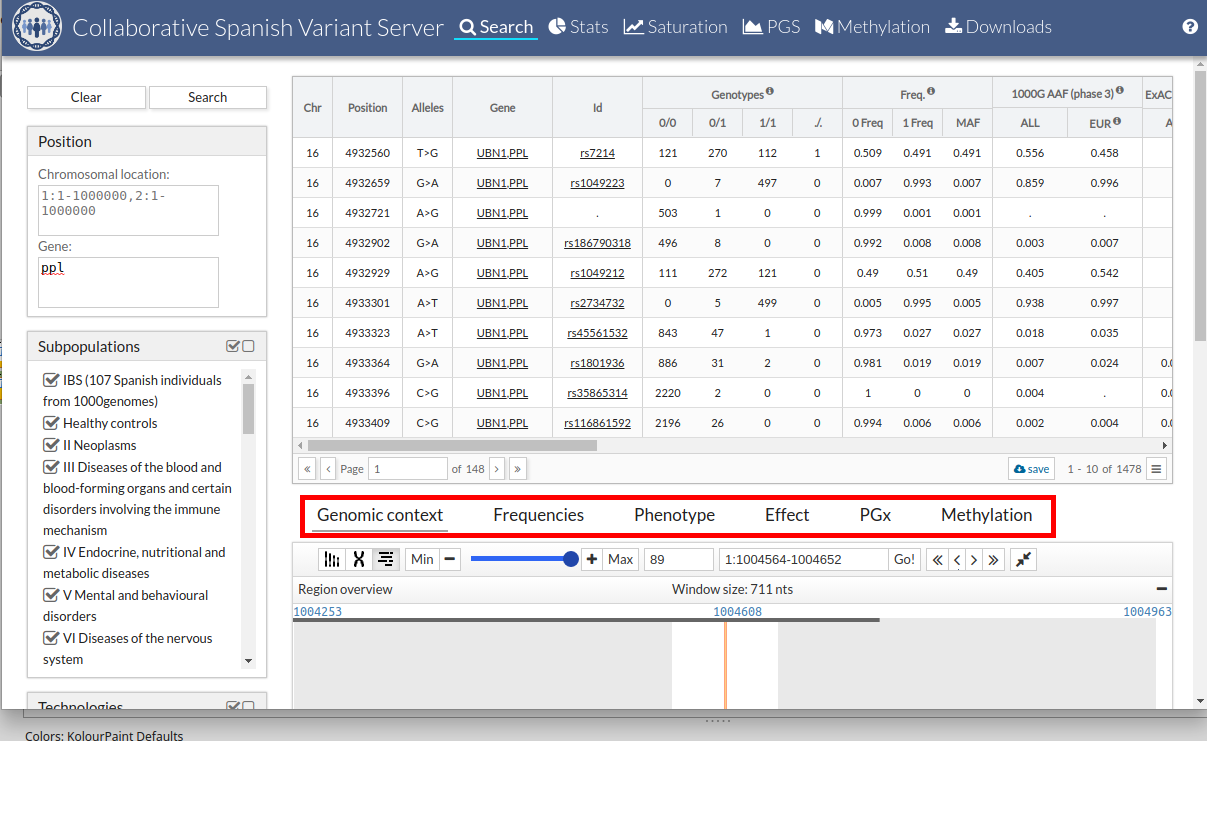
The first tab that we find in the lower part is "Genomic context". In this tab, the variant within the genome is contextualized. In the region overview area, everything near our variant is zoomed in very far. Later and if we are with a zoom that allows it, we will see the nucleotide sequence of the reference genome GRCh37. The next display area shows the genes and transcripts. The next the snp and finally the variables of the CSVS. To move through the genome just click and drag to the direction you want.
With the top buttons we can control the zoom and display or hide the display of the karyotype and chromosome panel.
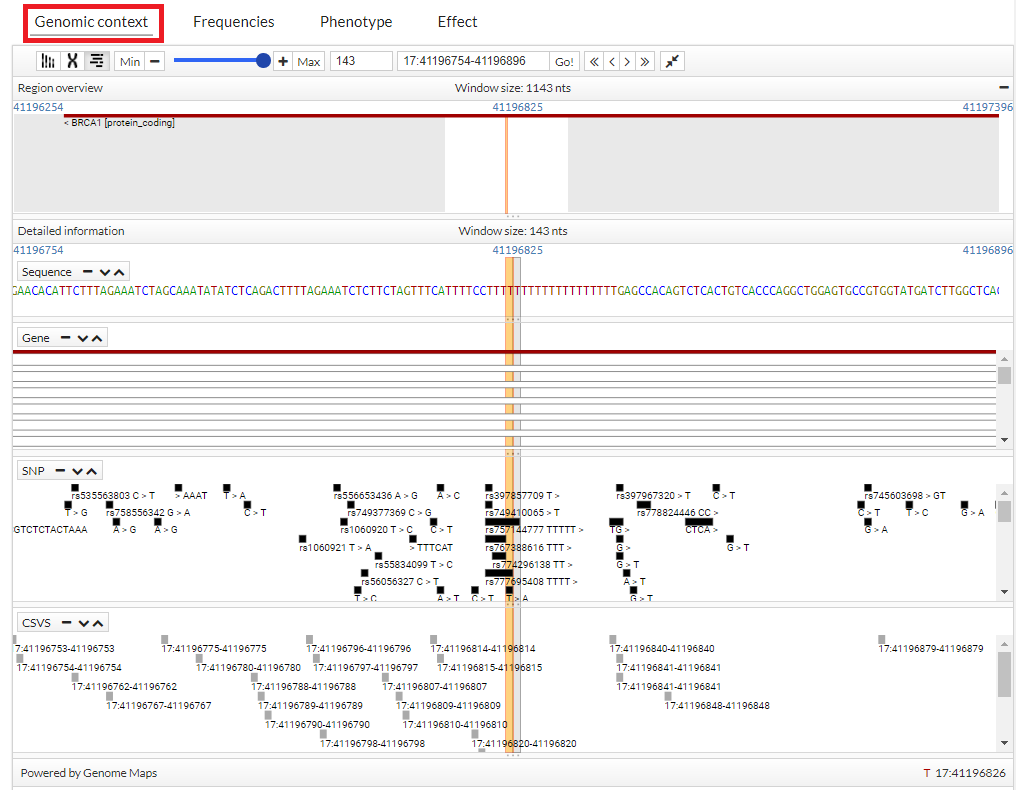
You can see more information, simply pointing the cursor over the region, gen, snp o variant.
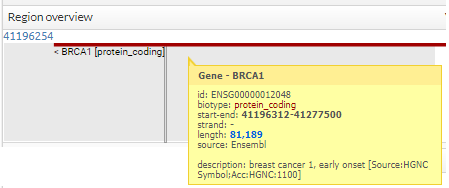
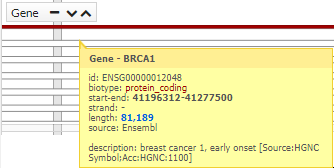
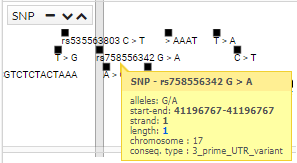

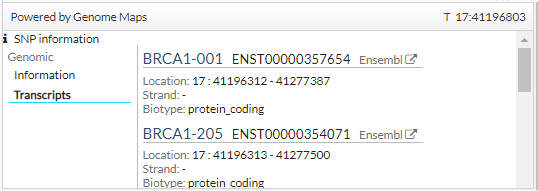
In addition, click a snp, you get more information (transcripts):
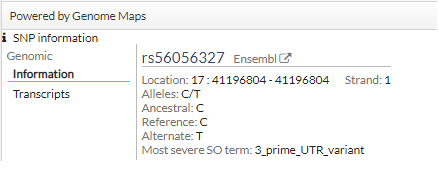
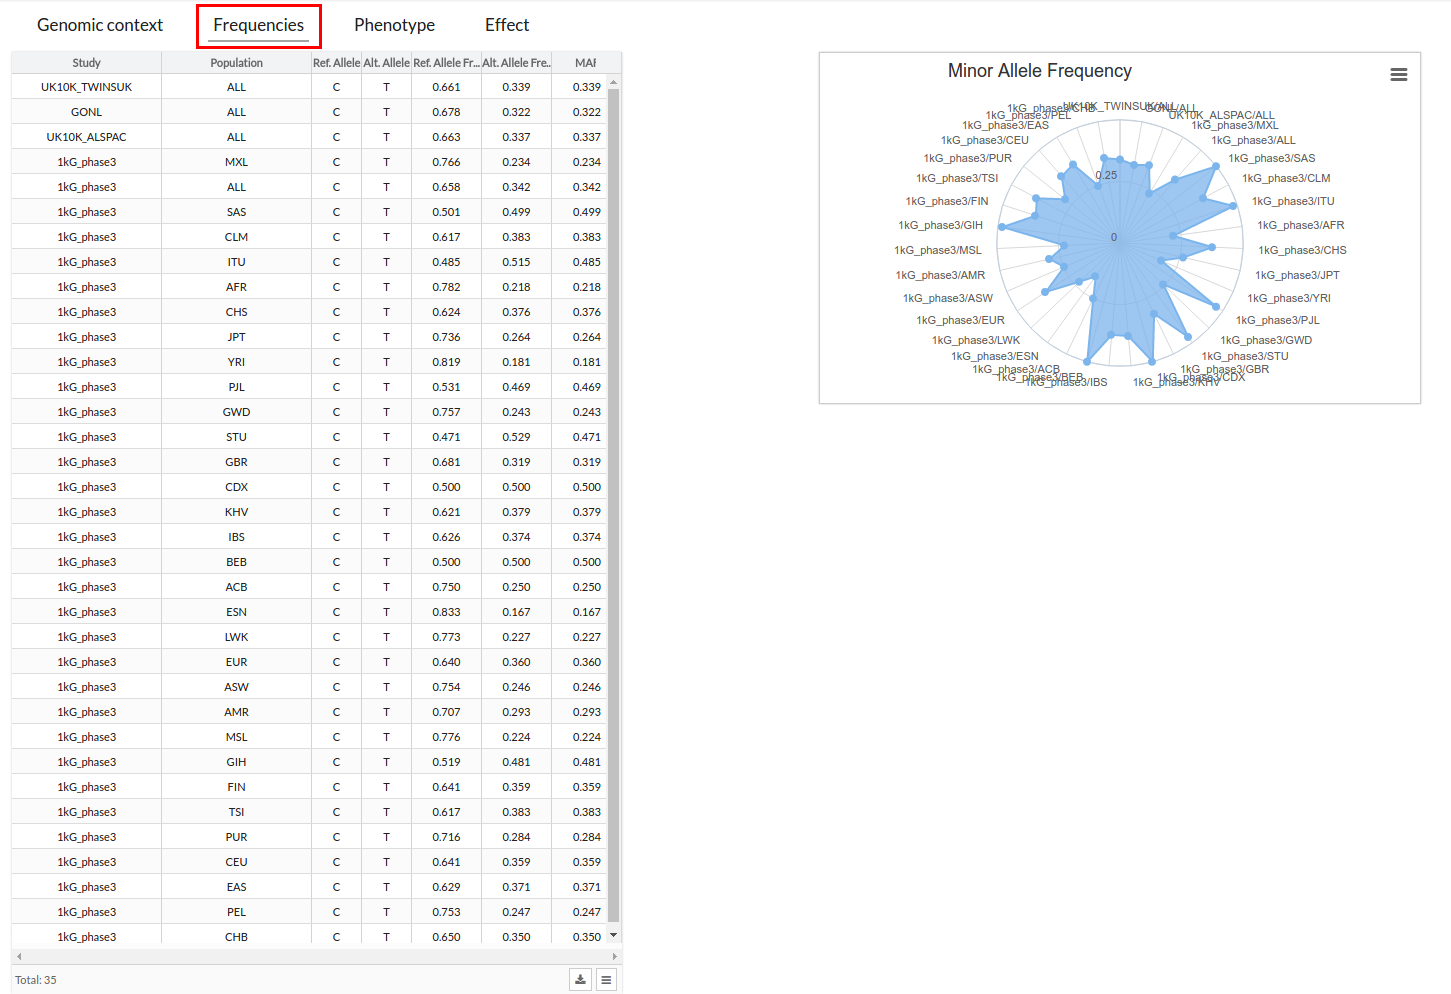
In this section you can see the different frequencies in the form of a table and a graph. With the graph you can see at a glance if the variant is a rare disease or not. If it is, a point will appear on the graph, if it is very common the painted part will be larger.
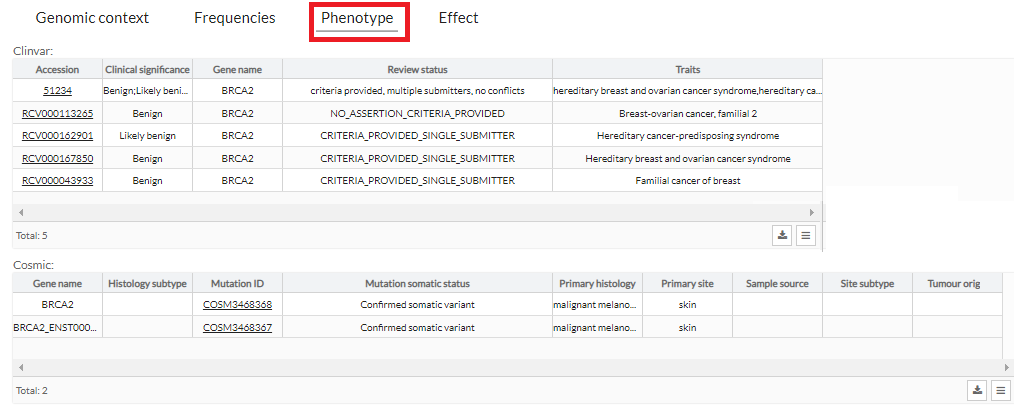
In addition to being able to see it in the table, in the phenotypes tab we can see a more extended description of the phenotypes that the variant has in different databases.
This tab shows the effect associated with the region where the variant is located in the Ensembl database.

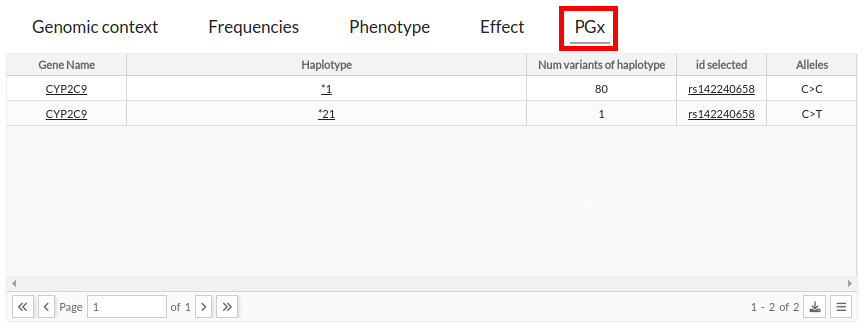
This tab shows the info pharmacogenomic associated with the variant is located in the pharmgkb
The PharmGKB is a NIH NHGRI sponsored research project (U24HG010615) funded to collect, encode, and disseminate knowledge about the impact of human genetic variations on drug response. (Cite)
The infomation that CSVS provides is gene, haplotype and number of variants container the haplotyple.
This tab shows the info methylation associated with the variant position.
You can see the graph of all the samples that have this methylation position. Additionally, there are some statistical information, as min, max, mean or quartiles that help us to understand the distribution.
There are two groups:
- Subpopulations: All selected subpopulations NOTE: If you selected "Healthy controls" this included this option. This also happens when you don't select any subpopulations. This information takes into account all selected filters.
- Healthy controls: Only group "Healthy controls" NOTE: This information takes into account the selected filters and existing in methylation (subpopulation).
The graph shows the red line that corresponds to the average Healthy Control.
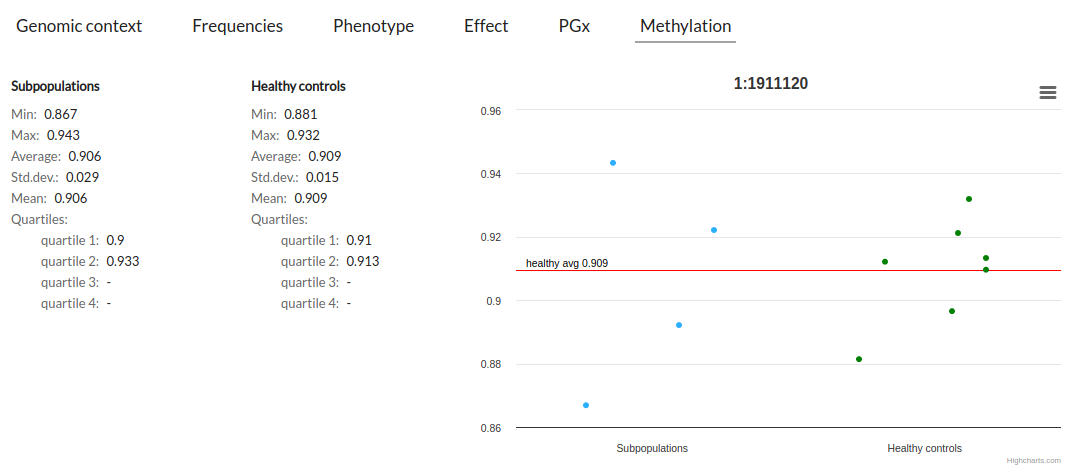
Table of contents:
-
1.1 CSVS structure
-
2.1 Beacon
-
3.1 Filters
3.2 Results
-
4.1 Variants and samples per disease