-
Notifications
You must be signed in to change notification settings - Fork 15
5 Sailfish Web UI
The “Environment” tab in Sailfish, allows the user to manage the services and their parameters. “Services” in Sailfish are used for configuring settings for specific connections.
If there is a need to verify the same business scenario on another system – it is not necessary to re-build your test script – you can simply change the connection to the environment and run the existing script without any modifications.

A new service can be added by pressing the “Add” button:

Service parameters also need to be specified. There are Required and Optional parameters. The Required parameters will be taken by Sailfish as key values.

Below is the example of a Test Service Required and Optional parameters setup for a FIX client.


Once the environment is configured, the connection can be started by pressing “Start”.

If it is started successfully, you will see the “Started” status.

If the connection configuration is incorrect, the status will be ERROR.
If a connection can't be established at the current time, the status will be WARNING.

The Test Scripts tab allows the user to perform the following:
- Upload an existing matrix (a CSV/XLS/XLSX file): the user can see all uploaded matrices as a list; the name, date and time of uploading are indicated;

- Create an empty form, so that the users’ own test cases could be written within Sailfish editors;
- Manage the list of uploaded or created matrices, i.e. to delete, edit, and launch a few selected matrices, a single matrix, or a group of matrices for execution. There are two options for launching the matrices for executions in the management panel at the bottom of the page:
-
-
 Continue if Failed (if disabled, Sailfish will stop executing a test script after the first failed case and skip all the remaining test cases. Otherwise, the test script will execute all test cases in a script irrespective of failures);
-
-
-
 Autostart (if enabled, the test services required for execution of a test script will be started (and stopped after script execution) automatically. Otherwise, the user will have to start the services manually from the ‘Environment’ tab);
-
-
If the user selects a single matrix, the following options are available:
-
- Edit the matrix in Sailfish editors: as plain text/grid editor;
-
- Edit the matrix in an Excel table;
-
- Launch the matrix for execution.

- Either the entire matrix can be launched, or certain test cases within a matrix can be selected and launched for execution (in the text panel opposite the script name);

- View the list of matrices that have been run or enqueued for execution;
- For matrices that have been executed, you are able to view an executed test case report. The report contains step-by-step information about the outcome of each test case and each sent and received message.

The Messages tab allows the user to interact with the “Messages” table in the Sailfish database. The table is used for storing messages from all services. The working area of the page is divided into the following sections:
- The “Wizard” and “Query” fields are used to create HQL (Hibernate Query Language) queries (more information regarding HQL is available here: http://docs.jboss.org/hibernate/orm/3.3/reference/en/html/queryhql.html);
- The “Limit” field is used to set the user’s query limit;
- The “Columns” field (when clicked) provides a drop-down list with fields available for showing in UI;

- The ‘Show/Hide raw messages’ button to the left of each message opens a raw message in Hex and a human-readable format.

In order to create HQL queries using “Wizard”, the user should follow the steps below.
- Click on the “Wizard” icon. The “Wizard” window opens:

- Pick one of the two options available: “Add rule” and “Add Group”. “Add rule” allows adding expressions which are executed side by side. “Add Group” allows adding expressions which are executed in a pre-assigned order. Also, two operations can be used: “OR” and “AND”. To create a query, select the required options Add rule or/and Add Group in the upper right corner of the window and operations OR/AND in the upper left corner of the window (a single operation for all rules and a particular operation for every group).
- Select a field in the table from the first drop-down list for every rule and group:

Where:
- Timestamp – the time when a message arrived;
- From/To – the service/gateway the message was sent to or received from;
- Admin – an administrative message;
- Namespace - used for technical needs;
- Name – the name of the message;
- HumanMessage – the contents of the message;
- RawMessage – a raw message in hex;
- Select operators from the second drop-down list for every rule and group:

- Enter a value (if required) into the last field for every rule and group;

- Press the “Retrieve” button. The created query gets included into the “Query” field, and the messages in the table are sorted accordingly.
Example: It’s required to filter messages by Add Order (NOTE!: the message name should be written without spaces as a dictionary or script). The following rule can be used:

Then, it’s required to filter AddOrder messages from the User1 service. To achieve that, add a new rule with the following rule using operation AND:

After “Retrieve” is pressed, the messages are filtered by the following query: msg_name = 'AddOrder' AND from_service = 'User1'.

All folders that exist on the local disk under <Deployed Tomcat>/webapps/sfgui/ are listed here and can be accessed from the Sailfish web GUI. The path to the folder can be specified in the “Path” field.

Once the folder is selected, the top panel gets activated.

You can navigate through folders by pressing  to open the folder and pressing
  to go to the parent folder.
It is also possible to get the folder size by selecting the folder and pressing “Get folder size”. The size will appear on the right side of the selected folder in the “Size” column.

You can download the selected folder as .ZIP by pressing ![]() or download selected file by pressing
or download selected file by pressing ![]() . To show file content, press
. To show file content, press ![]() .
.
Note: Logs of Sailfish services can be found in ‘\logs\services<environment name> path’.
The Sailfish ‘Dictionaries’ web page allows updating and changing the interface dictionaries for Sailfish services via the web GUI if there are changes in the interfaces (due to a new release or a bug fix).
To load an existing dictionary, click on the dropdown menu in the top left corner and select the required dictionary. The right part of the page is dedicated to the fields, while the left part is dedicated to the messages.

The user can search for a certain value, update it and add it to any message, e.g., select any field, on the right part of the page. Expand the attributes and values of the field by clicking on the left button.

Then, the user can update, add or delete them. After that, you can select the message on the left part of the page, where the updated or the added field should be included.
The user can update messages as well. A new dictionary can be created using one of the two ways described below.
-
Close the dictionary if any existing one is already loaded by clicking on
 in the top right corner.
 -
Click on the “New” button.

Empty fields and messages areas are added as follows:

- Add messages in the left part of the page as per the interface specification documents.
a) To add a message, click on “Add message”. In the window that pops up, specify the name of the message (NOTE!: the name should be written without spaces and it should be unique, e.g. NewOrderSingle) and its description and press “OK”. The message is added to the messages and can be seen in the left part of the page.
Example:

b) Expand the message by clicking on the left button and add attributes to the message (if required) by clicking on  near the Attributes:

c) In the window that pops up, all fields are mandatory:

Where
- Name (NOTE!: the name should be written without spaces and it must be unique among the names in the field);
- Value should be applicable to the specified JavaType of the attribute;
- JavaType - data type which can be kept in the field;
- Add the fields to the message based on the interface specification documents.
There are 2 ways to add a field to a message:
- If a field has a limited quantity of values, it must be displayed on the right part of the page and it’s better to include it there if the same field should be added to several messages. Then, add them to all the required messages. To achieve that:
a) click on “Add field” in the right part of the page to add a new field.

The following fields should be populated in the window that pops up:
- Name – this is a mandatory field (NOTE!: the name should be written without spaces and it must be unique among the fields in the right part of the page);
- Description – this is an optional field;
- JavaType – this is a mandatory field; this is a data type which can be kept in the field;
- Default value – this is an optional field; it will be used if a value in the message being sent is absent. If a field does not have a default value, any value applicable for the field type can be specified. Otherwise, only one value from the ones specified for the field can be used.
b) After populating the fields, press “OK”. The field is added to the fields in the right part of the page.
Example:

c) Expand the field by clicking on the left button and add attributes and values to the field (if required) by clicking on  near the Attributes and
  near the Values.

In the window that pops up, all the fields are mandatory and should be specified as described above.
d) Include all the required fields listed in the left part of the page into the messages.
e) Select a field from the right part of the page and a message from the left part of the page, where it’s required to add the field, and press ![]() :
:

f) Populate the fields in the window that pops up (if required) and press “OK”.

The field gets added to the message as a reference field:

g) Expand the field by clicking on the left button and add attributes (if required) by clicking on  near the Attributes (NOTE!: all fields are mandatory in the pop-up window, as described above).

- The second way is adding a field straight into a message. To achieve that, perform the following actions:
a) Select the message and click on “Add field”.

b) The following fields should be populated in the window that appears:
- Name – this is a mandatory field (NOTE!: the name should be written without spaces and it must be unique among the fields in the right part of the page);
- Description – this is an optional field;
- “Is required” is ticked when it's a mandatory field of the message;
- “Is collection” is ticked if a field can contain several values;
- Type – this is a mandatory field if Reference field is not present; this is a data type which can be kept in the field;
- Reference – this is an optional field, a prototype of the field from the right part of the page, from which JavaType, Attributes and Values are inherited.

c) Then, add all required attributes to the field as described above.
NOTE!:
- If an existing message should be included as a field of a message, select Type = Message and Reference = Message name which should be added;
- Fields should be added according to the specification. To change a field position, select the field and use left-hand arrows of the Messages area. The numbering starts from 0.
- After creating all required messages and filling them up with required fields, save the new dictionary by clicking on “Save as”, fill in all the fields in the dialog window and click on “Save”.
NOTE!: Don’t close the dictionary while adding messages and fields, since changes won’t be saved in this case. Alternatively, save your changes regularly.
NOTE!: The name of the dictionary should be unique.
The new dictionary will be available right after it has been created. If a user is updating the existing one, it is enough to clean the cache by pressing  in the same browser tab where the dictionary editor is opened to ensure the dictionary works properly.
To validate the dictionary to make sure it matches the service that the dictionary is used for, do the following:
- Choose a validator which matches the service the dictionary is used for:

-
After selecting a validator, a dictionary will be checked with the validator right away. A pop-up message appears, displaying errors, if there are any.
-
All elements with errors will be highlighted in red. A message with the explanation will be shown if you hover over an element.
To update a dictionary, do the following:
-
Move to the “Dictionary” tab and select the required dictionary under the “Select dictionary” dropdown menu.
-
Change any messages and their fields in the right and/or left parts of the page.
a) To change attributes/values and other parameters of the message/field, do the following:
- Click on the left button;
- Click on any field and overwrite the value;
- Click on “Enter”;
- To delete attributes and other parameters of the message/field, click on [x].
b) To change message fields, do the following:
- Expand the message by clicking on the right button;
- Change attributes and other parameters as described in the previous point;
- To delete attributes and other parameters, click on [x];
c) To remove a message/field, select it and click on “Remove”.
d) To add a new message/field, click on “Add message/field” and refer to the relevant actions described in the dictionary creation section (steps 3-4 of Method 1).
-
When the above is done, click on the “Save” button.
-
Clean the cache on the browser tab where the dictionary editor is opened to ensure the dictionary works properly.

The search form with searching options and plugins installed is displayed in the left part of the window. Each plugin contains the following units:
- Actions – the available actions with their description;
- Dictionaries – the available dictionaries with their structure description;
- Services – a list of services available in the plugins, organized by name;
- Languages – the supported matrix languages;
- Matrix providers – the implemented methods of loading matrices to Sailfish.

You can find help on the Actions, the group types of which are listed below:

- Common Actions – a set of basic actions for performing simple tasks;
- Fake Actions – actions that emulate receiving fake messages; these actions are used in automated testing;
- Service Actions – actions dedicated to operations with the service;
- Test Actions – actions dedicated to interaction of the Sailfish service with a remote system.
By pressing each of the Actions, you will see the method information and other details in the right part of the window.

On the Sailfish Help page you can also find tips on how to use Date, Math and other Utils.

The implemented dictionaries are listed as follows:

By selecting the dictionary and the message, it is possible to see Help on each of the fields.
Example of Help on a MessageType Field:

Clicking on a particular field gives the option to Copy to clipboard by clicking on  and the option to Set custom header by clicking on
  in the top right part of the window.
Alternatively, you can type the name of the action/message in the  field in the top left part of the window to get a help window on it.
By clicking on ![]() you can choose the search parameters.
you can choose the search parameters.

Example:

The list of implemented Services can be found in the left part of the Plugins window as well. By clicking on each of them, you can see the Service information.

There is also Help on Languages and Matrix providers.

The “Configuration” tab contains the following sections:
- Update Version – contains the update settings and information about Sailfish components;
- Database – contains Hibernate settings or connection to the Sailfish database;
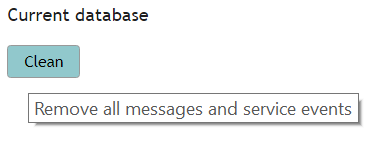
- Logging – to configure logging. The “Clean” button will erase all messages and service events from the database;
- Workspace – to configure workspaces;
- User Events – contains information about user events/messages;
- Statistics DB – to configure the Sailfish statistics database;
- Flight Recorder – to make a profile recording;
- NetDumper – to record pickups for network traffic recording;
- Machine Learning – to get machine learning data and analyze execution reports;
- EMail Notification – to send notifications with execution results to the user’s email;
- Cleanup – to perform cleanup of reports, matrices, etc.;
- Big Button – helps to run several matrices on different instances of Sailfish, which are connected, and send execution reports to the main one.
Navigating to the Configuration Page, first the Update Version tab with the relevant information will appear. Here, the list of Sailfish components can be observed.

In the Database tab you can find the current status of the Database to which Sailfish is connected, manage the hibernate settings and perform the cleanup of the Database removing all messages and service events.
These settings are used for HDD storage of the db type which is configured on Workspace -> Storage Type.
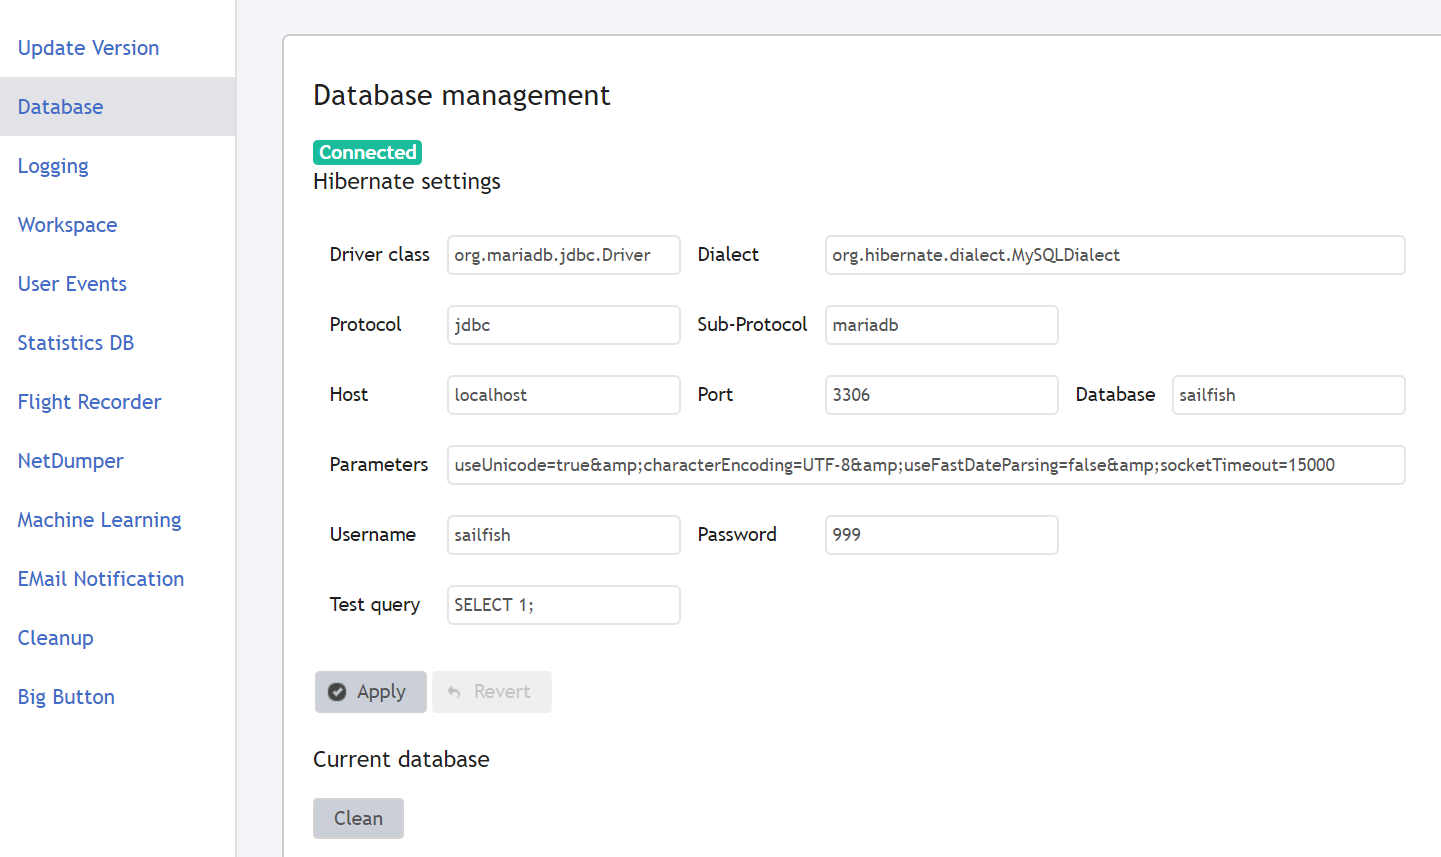
Note: Only one Database can be connected to Sailfish.
In the Logging tab, the Log configuration can be changed.
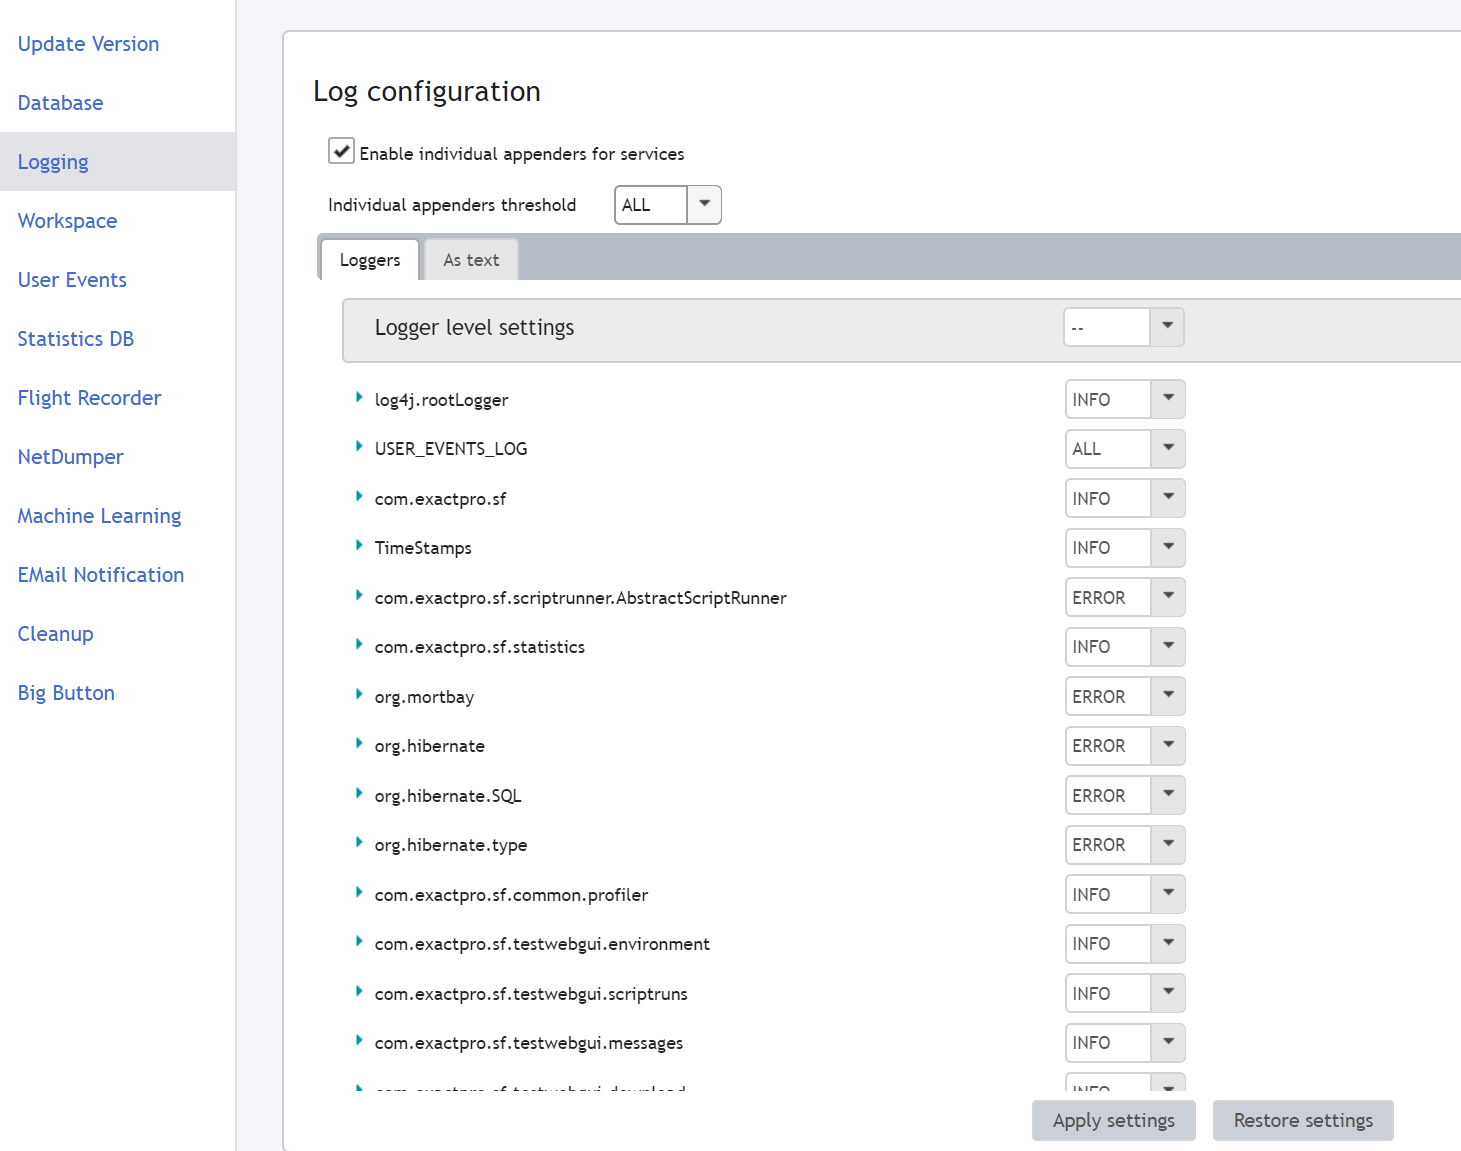
You can enable individual appenders for services by ticking the corresponding checkbox  .
.
In the drop-down menu, it is possible to select the Individual appenders threshold.

In the Loggers tab, you can either configure the logging level for all loggers at once in the corresponding drop-down menu or change this setting for each of the Logger.

By navigating to the “As text” tab, you can see the same settings displayed in the text manner.

You can either Apply  or restore the settings
  after making the changes.
Sailfish workspaces allow you to keep the main Sailfish distribution, user configurations and dictionaries separated. This makes it possible to upgrade Sailfish or dictionaries leaving the user files as reports, matrices and database connection settings unchanged. Among single project needs, such customization can vary, and it was decided to introduce several workspaces.
The environment settings which can be changed are displayed below:

- Notification If Services Not Started – is used to notify the user, before matrix execution is started, if the services specified in the test script are not started.
This feature can be useful when running the test scripts manually, because it allows to take an action before the execution is started.
If Notification If Services Not Started=true, and at least one of the services specified in the matrix is not started, the execution of the test script will be on hold, which would be observed on the Test scripts page in the Reports, and on the Matrix execution panel the user will see: ’The following services have not been started’ (not started services will be listed). The user will be able to move to another step, continue or stop the execution.
-
Max Storage Queue Size – maximum MQ volume capacity in RAM for saving messages in HDD. If the memory is full, the arrived messages will not be stored. These messages will not be displayed on the Messages page, neither in the ‘All Messages’ table in the report and will not be found using the retrieve action. MQ overflow can be provoked by the arrival of a large number of messages. The ‘Max Storage Queue Size’ functionality allows preventing JVM crash with OutOfMemory error.
-
Excluded Messages – messages which will not be stored in the DB, and the user will not see them in the report or in the Messages page.
The excluded messages must be listed separated by commas and must have the same names as the ones set in the dictionary.
This feature might be useful for messages like Heartbeat – this will allow to decrease the size of the report, thus, saving memory, excluding undescriptive messages.
- Fail Unexpected – the setting that allows the user to set up the default value in the #faild_unexpected field, which sets the way of comparing the messages, for example, in the receive action.
Possible values in the #faild_unexpected field:
N or n – only filtered fields are checked;
Y or n – all fields in the message are checked;
A or a – all fields in the message as well as the message structure are checked.
- Comparison Precision - allows to set up the default sensibility of numeric values with a floating point. The values are considered equal when their absolute difference does not exceed the set value.
Comparison Precision is considered when Receive actions are executed and can be re-set up using the Precision application function.
- Matrix Compiler Priority – is used for regulating the priority between the Matrices compilation and the rest of the actions: start of the services, matrices execution and general Sailfish processes.
Integer values have to be specified: 1 – minimal priority, 10 – maximum priority. By default, 5 is used.
- Store Admin Messages – the setting that allows the user to store or not to store admin messages in HDD storage (e.g. messages for creating, maintaining and closing the connections between the services and the target server).
If admin messages are being stored, they will not be displayed in the report or on the Messages page, and they will not be obtained via the retrieve action.
Not storing admin messages will save the space in HDD storage.
- Async Run Matrix – this parameter is used for changing the matrix execution mode.
false – sequential execution (only one matrix will be executed at once);
true – execution in parallel (this mode allows to run up to 3 matrices at once, unless the same services are used in these matrices).
-
File Storage Path – the directory where the files which contain all the sent/received messages are stored.
-
Storage Type – this setting allows to set the type of HDD storage used for the long-term storage of the received/sent messages.
Supported storage types:
file – for each message, a separate file is created in the directory specified in the ‘File Storage Path’ field. This type of storage is recommended to be used when opening Sailfish for a short period of time: to check the connection to the test system, to run a smoke test, for demo demonstration.
When using this storage type, the user cannot query the messages on the Messages page.
db – messages are saved in a Database. The DB connection should be set up in the Database tab. This storage type is recommended for long-term work with Sailfish.
- Relevant Messages Sorting Mode – this setting allows to change the way of displaying similar messages in the failed actions of the report.
Supported parameters:
ARRIVAL_TIME – similar messages will be displayed in the same order as they have been received by the service (by default);
FAILED_FIELDS – similar messages will be displayed in the report sorted by the number of failed fields, from low to high. This function is only supported in an HTML report.
NOTE!: Changes of the following settings will be applied only after Sailfish restart:
- Max Storage Queue Size
- Excluded messages
- Comparison Precision
- Matrix Compiler Priority
- Store Admin Messages
- Async Run Matrix
- File Storage Path
- Storage Type
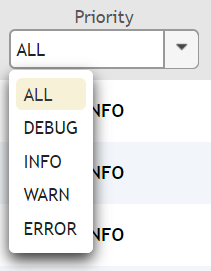
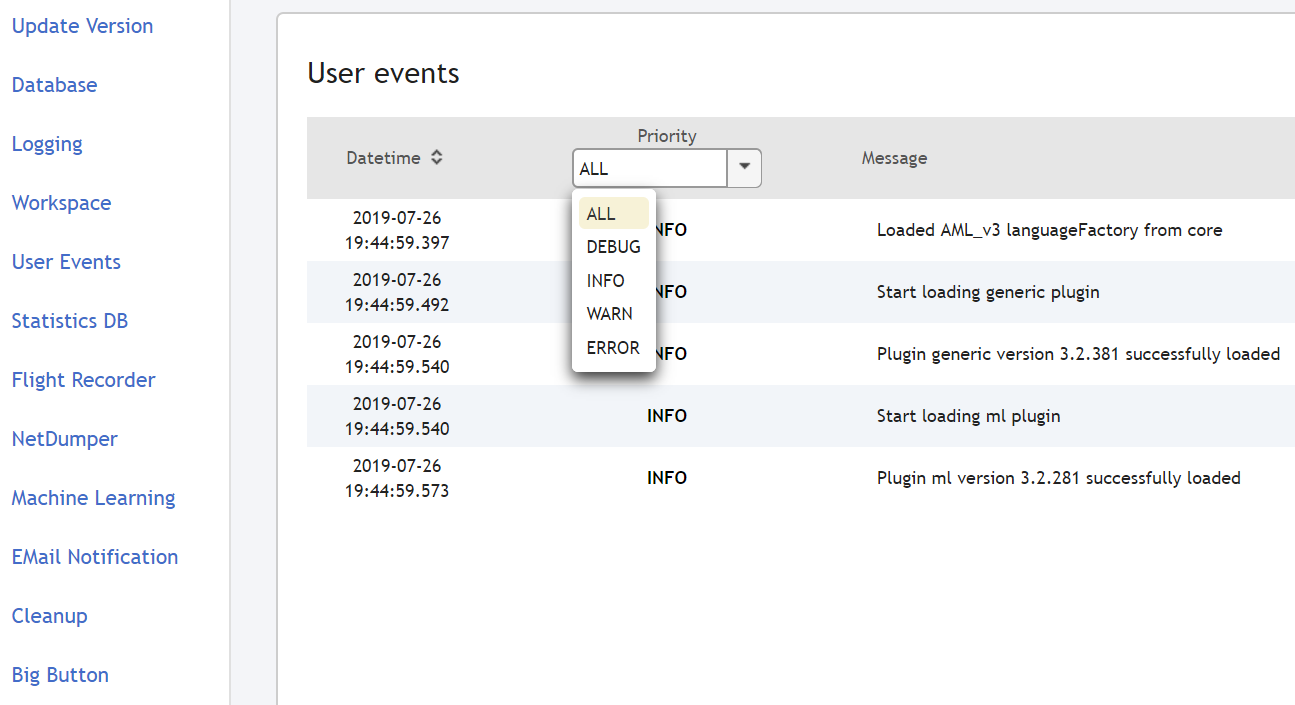
By selecting the Priority from the drop-down menu, it is possible to see all the related events.
The messages will be displayed in the right part of the window.
The collection of statistics allows to accumulate the test execution data, as information about matrices, timing, fails, etc., which allows the user to make test analysis, such as:
- Monitoring of the current work;
- Test runs history revision of each test case (which can be found by its unique #id);
- Analysis of test execution reports;
- Test suite runs comparison.
To save the information about matrices runs, a separate DBMS is used (MySQL and Postgresql are currently supported).
First, the user has to create a DB using one of the create_mysql_statistics_db/create_postgresql_statistics_db scripts, which can be found in the Sailfish core distributive, DB folder; or set up the connection to an existing DB from Configuration page > Statistics DB tab in Sailfish Web GUI.
If the user tries to connect to a newly created DB or a DB with the schema version below the current one, it will look as below.
The user will need to migrate the newly created DB.

Then, the user can change the Statistics database setup on the Sailfish Configuration page in the Statistics DB section.

Check the "Store matrix execution statistics in statistics DB" and press “Apply”.

You can also remove all the messages and service events by pressing the ‘Clean’ button.
NOTE!: Several Sailfish instances on different hosts can be configured to use the same statistics database. Thus, all statistics from all configured hosts will be aggregated in the same database and can be retrieved from different hosts.
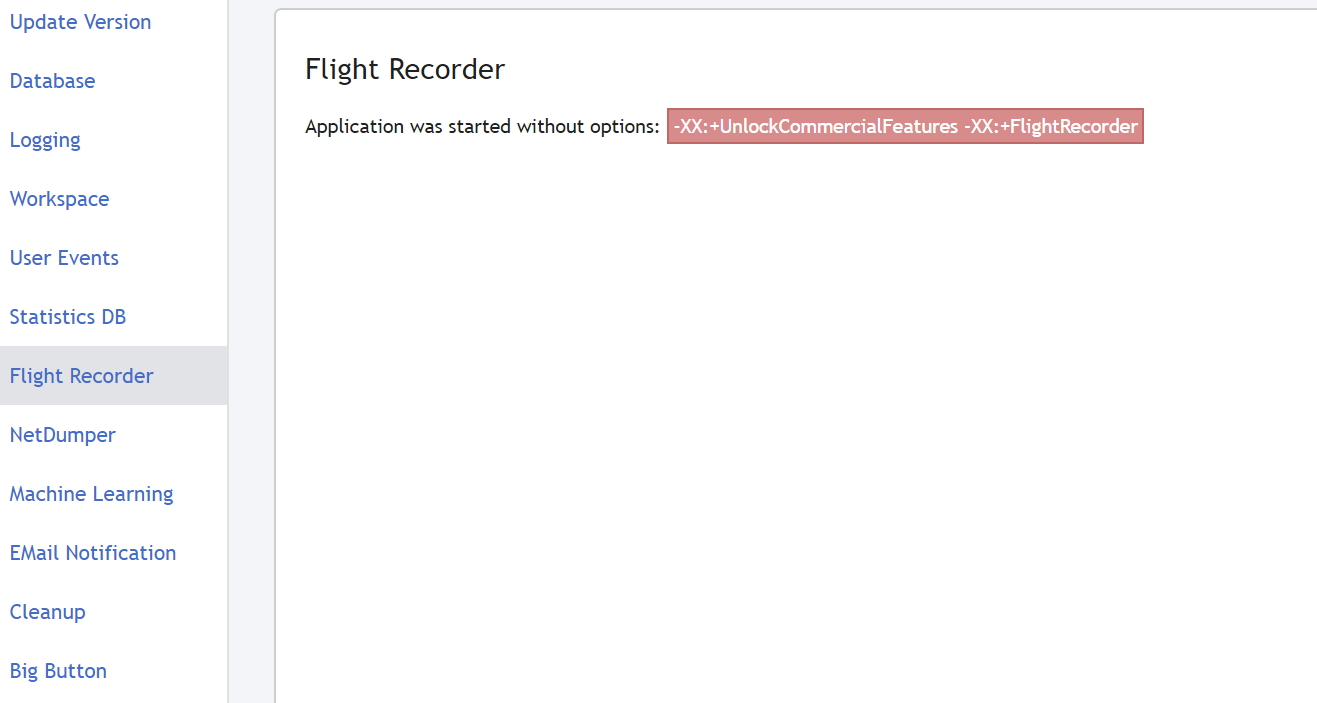
Flight Recorder is used for profiling recording (how many files have been run, how many resources have been spent, etc.)
Note: Flight Recorder is currently being incubated.
NetDumper has been developed to record pickups for network traffic recording.
NetDumper has to be connected to a specific REST API instrument which is integrated into Sailfish before running a matrix, so that the network traffic is recorded. Pickups are attached to the execution reports.
Note: NetDumper is currently being incubated.

The machine Learning functionality is used for getting machine learning data and analyzing the execution reports.
For analyzing the reports, an additional plugin must be integrated into Sailfish; the plugin depends on the project/client, etc. This plugin is developed based on the existing reports of a team and the logic of failing or passing the actions. Before this plugin is developed, test data should be collected.
Ready to receive the training data functionality – is used for collecting the test data, which, afterwards, will be used for the logic to be integrated in the plugin.
The status of ExtensionML shows if the plugin is integrated into Sailfish.
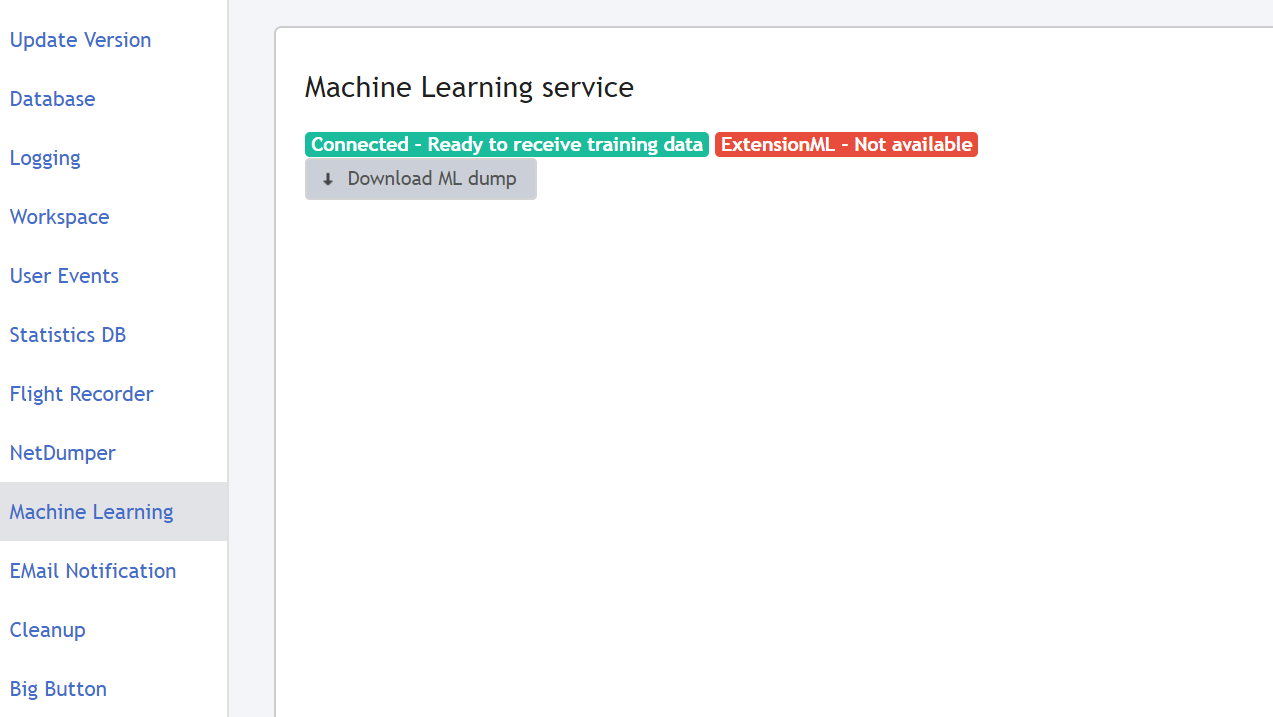
By pressing Download ML dump, a .zip archive with training data will be downloaded.
On the Sailfish Configuration page in the EMail Notification section it is possible to enable Email Service by ticking  checkbox and change the email settings.
Email Notification functionality is used for configuration of sending notifications with the execution results to the user’s email.
- First, Email service should be set up.
Example of Email Notification setup is shown below:

- Then, the Big Button notification should be set up.
Example is shown below:

- In Big Button config, the “send_email” action should be specified in the “execute_on_passed” and/or “execute_on_failed” and/or “execute_on_conditionally_passed” columns.
Example:

- After running the Big Button config, you will receive the notification.

Cleanup can be performed in the Cleanup tab on the Sailfish Configuration page.
First, select day/time from which the cleanup should be performed.
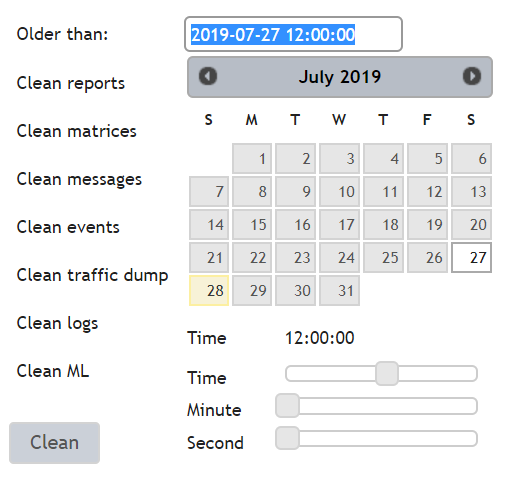
Then, tick the corresponding checkboxes depending on whether you need to clean the reports, matrices, etc.

Once ticked, press  button to perform the cleanup.
Using Big Button, the user can run several matrices on different instances of Sailfish, which are connected, and obtain execution reports on the main one.

This is the page for automated execution of a structured test library.
Big Button functionality allows the user to run several matrices on different instances of Sailfish connected between each other and obtain execution reports on the main instance of Sailfish.

For working with BB the user will need:
- to have the BB configuration in .csv format;
- one or more started Sailfish instances;
- to have the library of scripts and services for the workspace.
Main possibilities when working with BB are the following:
- individual and general setup of the parameters for the test set run;
- monitoring the test execution on several instances of Sailfish and changing the test script execution order, in case of unavailability of one Sailfish instance;
- collection of the statistics on test runs on all instances of Sailfish;
- REST API supported.
First, the user should load the configuration file from the local machine and, then, press Submit button.

Then, the user can proceed with the execution of the script by pressing Start.

After the Start action is chosen and before the execution starts, a dialog is offered to the user requesting (optionally) to clean old data such as Sailfish logs, BB execution reports, etc.
Note: In case the user presses the Never button, once the corresponding setting in the Big Button tab in Sailfish is changed, the pop-up window with pre-run cleanup option will be shown again.

The process of running the BB test script will look as below:

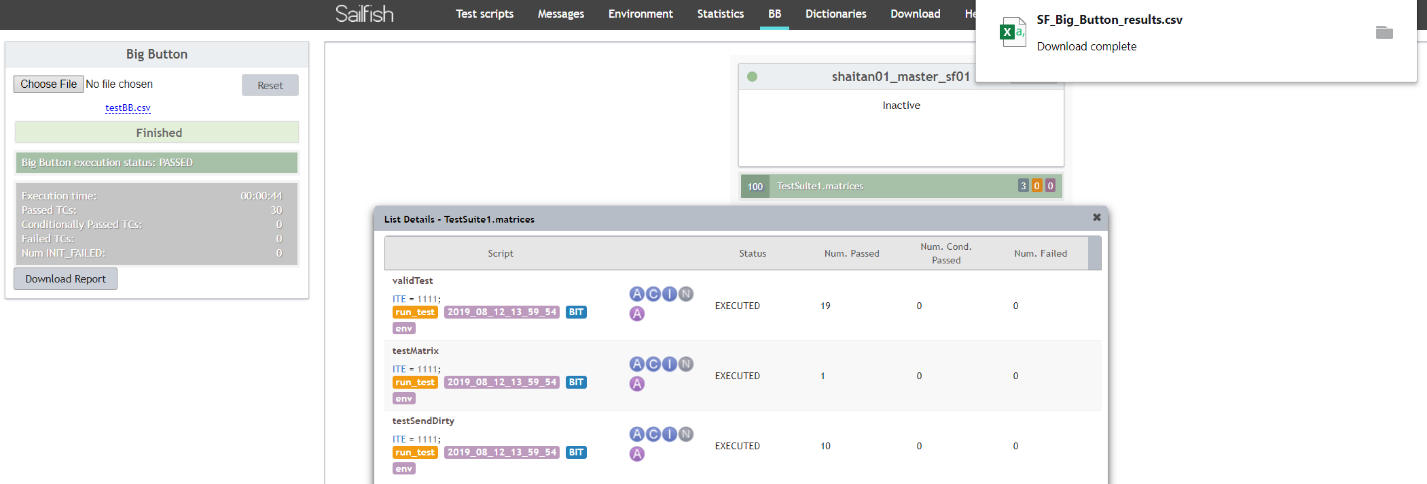
Once the execution is done the Big Button execution status and the results can be observed.

After execution, a high-level summary report is available for download in .csv format with the following information:
· Executed Scripts;
· Status (Executed, Interrupted or Init failed);
· The number of passed test cases per a script;
· The number of conditionally passed test cases per script;
· The number of failed test cases per a script.

You can download the report with the results by pressing Download Report on the left part of the window:
The results will be shown in the .csv file as below:
