Open
Conversation
Contributor
|
Awesome, thanks for the PR! I will take a look through. One thing, you might be able to remove the keymaps by adding the ‘native-key-bindings’ class to the browser. |
Contributor
|
@twynsicle Thank you, this is huge! Wondering if we are (technically) able to do the same for iOS / Safari debugger? |
Contributor
|
This seems like an awesome feature. Why was it not implemented? |
Member
|
@developer82 There's a few things that made me put this on the backburner when I took a first look.
|
Contributor
|
Thanks. Is there a plan to allow debugging in Atom? |
d64dcb2 to
c0965b5
Compare
Member
|
@developer82, I can't make any guarantees. We will probably plan to investigate it, but unlike VS Code where debugging is a first class citizen of the editor, we may not be able to fully achieve the experience that we wish to provide. |
Merged
This file contains hidden or bidirectional Unicode text that may be interpreted or compiled differently than what appears below. To review, open the file in an editor that reveals hidden Unicode characters.
Learn more about bidirectional Unicode characters
Sign up for free
to join this conversation on GitHub.
Already have an account?
Sign in to comment
5 participants
Add this suggestion to a batch that can be applied as a single commit.This suggestion is invalid because no changes were made to the code.Suggestions cannot be applied while the pull request is closed.Suggestions cannot be applied while viewing a subset of changes.Only one suggestion per line can be applied in a batch.Add this suggestion to a batch that can be applied as a single commit.Applying suggestions on deleted lines is not supported.You must change the existing code in this line in order to create a valid suggestion.Outdated suggestions cannot be applied.This suggestion has been applied or marked resolved.Suggestions cannot be applied from pending reviews.Suggestions cannot be applied on multi-line comments.Suggestions cannot be applied while the pull request is queued to merge.Suggestion cannot be applied right now. Please check back later.
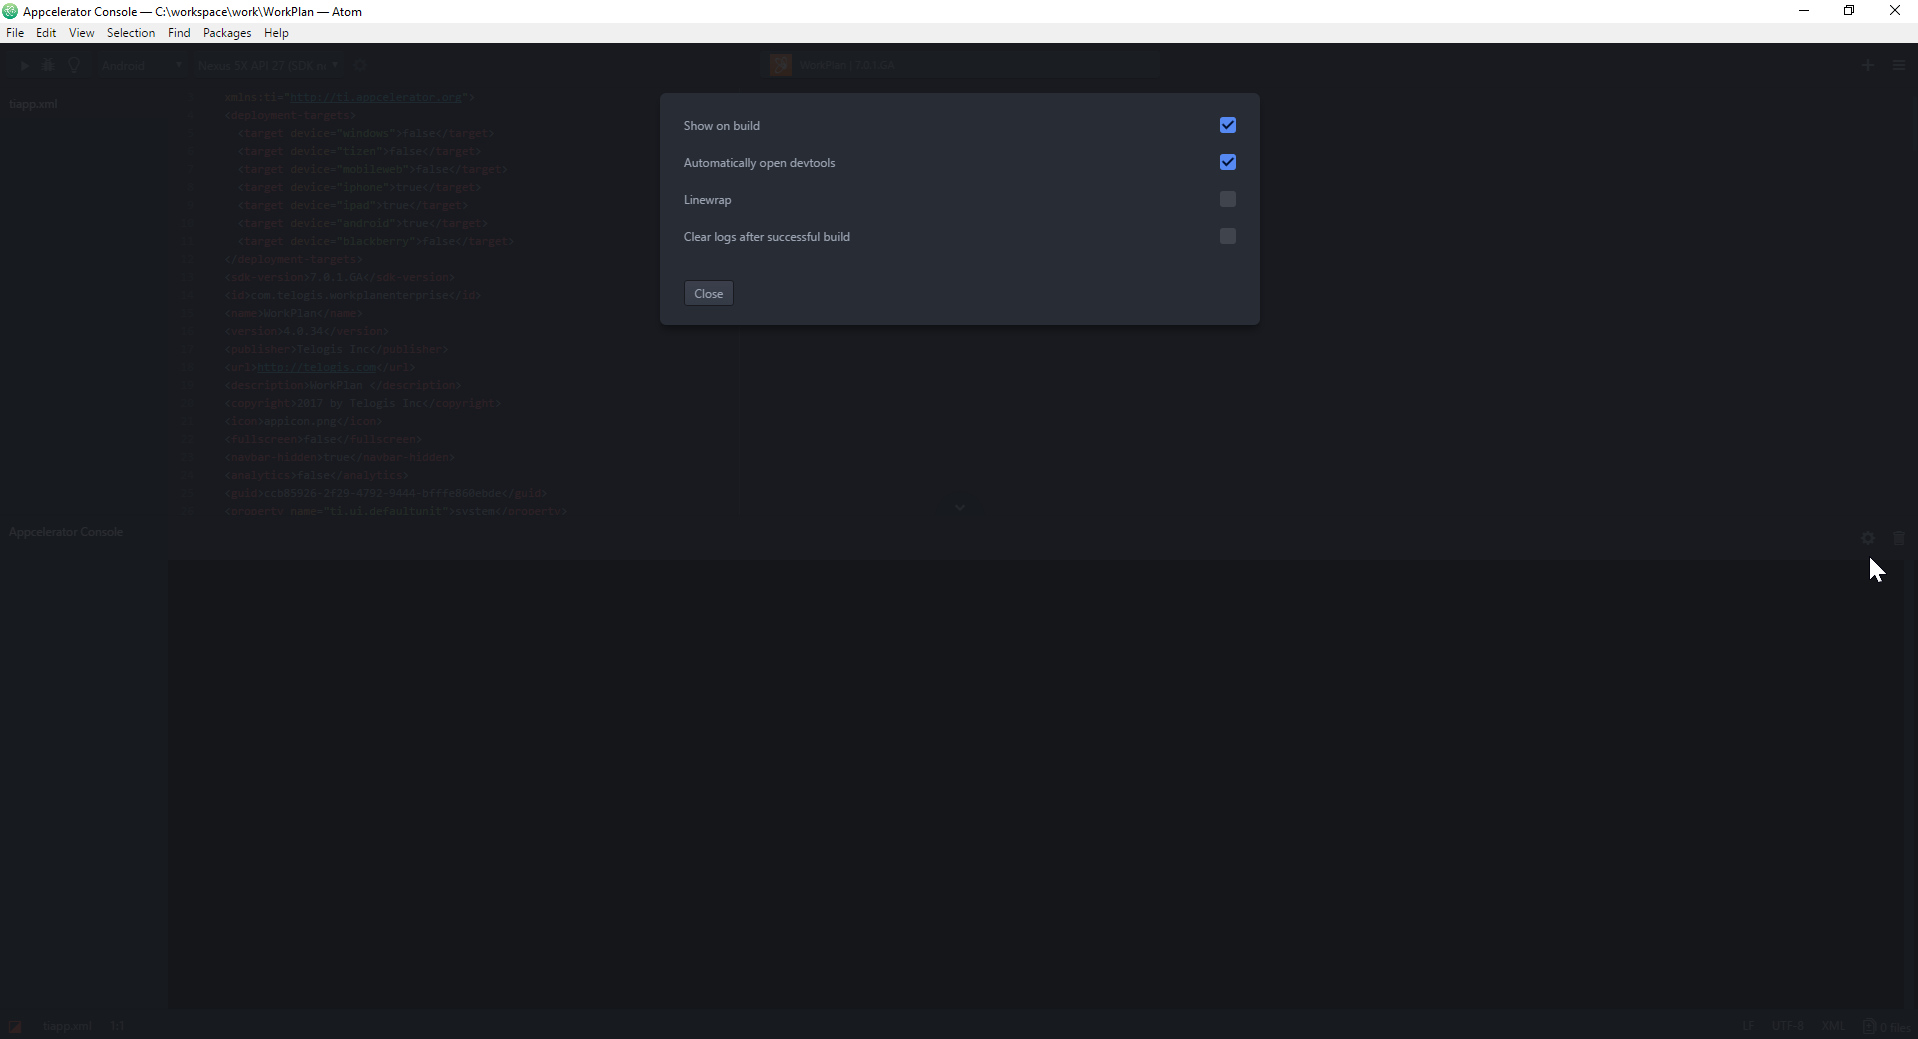
Scans console logs looking for the link to debug in dev-tools and opens the dev-tools automatically within atom, as per the following screenshot.
There are two features missing from this pull request as I wasn't sure how to incorporate them into the existing UI.
a) A way to add the
--debug-host adb:55283flag to the build - currently this will only work using thecustom argsrun option.I've been experimenting with the following, but it lacks a way to customize the port number.

b) A way to disable this feature if the user would rather open the dev-tools in Chrome. Currently there is no configuration menu to hook into