-
Notifications
You must be signed in to change notification settings - Fork 0
MoMA Properties
This page explains individual settings in the mm.properties file that is used to configure MoMA.
- About the mm.properties config file
- Obtaining the mm.properties file that was used to track a GL
-
Explanation of individual settings
- Graphical user interface settings
- Settings that control the image processing and generation of tracking problem
- Settings for optimizing the linear program
- Export settings
- OLD EXPLANATION
MoMA settings are stored within a single configuration file. By default MoMA uses the configuration file located at:
$HOME/.moma/mm.propertiesThis file will be used, when the user does not specify a configuration file, e.g. when running:
moma -i /path/to/input/image.tiffUsers can specify a specific configuration file using the option -p CONFIG_FILE:
moma -p /path/to/other/mm.properties -i /path/to/input/image.tiffIn general, it is advisable to create a configuration file specifically for your analysis and to use it with the option -o. This ensures that you are using the correct setting for your analysis and also allows you to keep a copy of mm.properties for later reference and to continue the analysis, if needed.
Furthermore, MoMA creates a copy of the mm.properties file in the export folder during export. This copy is used, when reloading the curation state of a GL, and can also be used to continue the analysis of the experiment or similar data.
This section explains the setting in mm.properties in detail. The settings can be categorized into settings that affect:
- the graphical user interface (GUI)
- the image processing and generation of the tracking problem
- the optimization of the tracking problem
- the export of results
- This setting controls the number of time-steps that are shown next to each other in the MoMA GUI.
- The optimal value will depend on the resolution of your screen. As rule of thumb:
- with
1920x1080screen resolution:23 - with
2560x1440screen resolution:27
- with
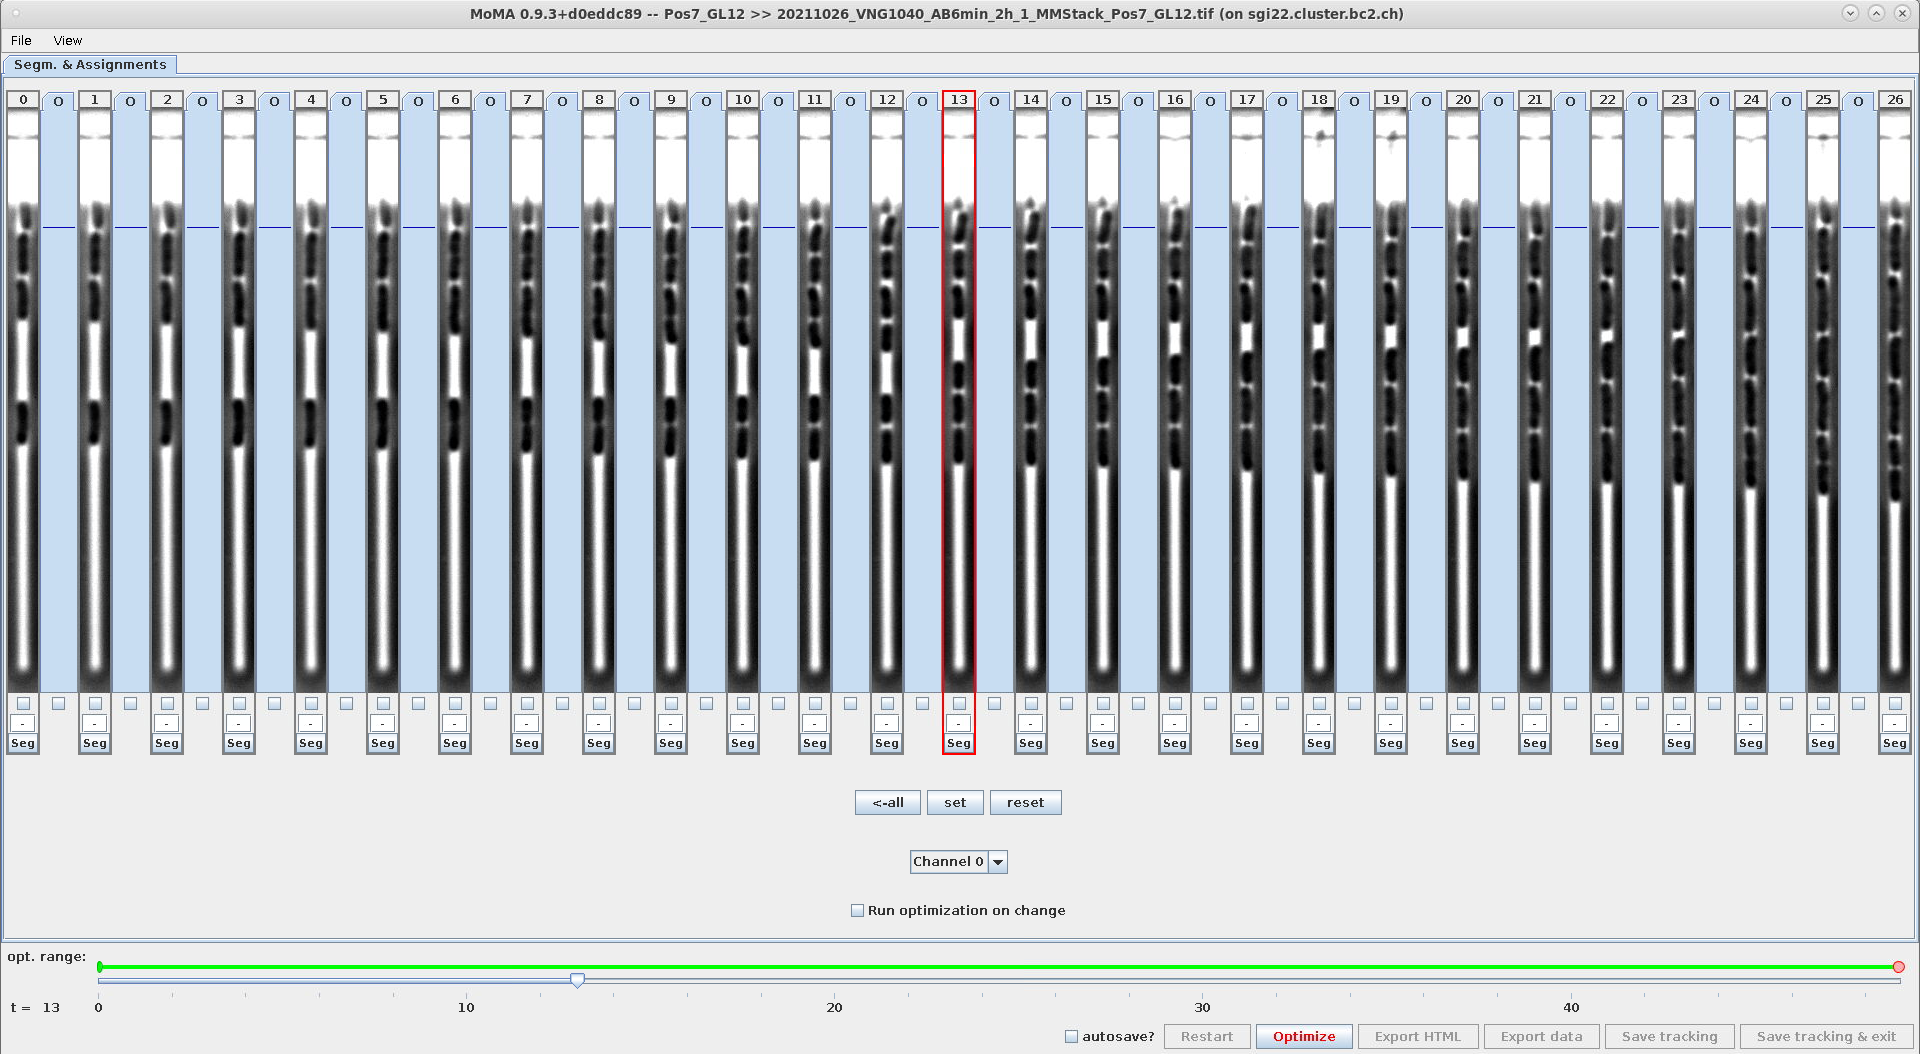
- This screenshot compares the GUI with 13 vs. 27 time-steps:
Screenshot of GUI with 13 time-steps at resolution 1920x1080 Screenshot of GUI with 27 time-steps at resolution 1920x1080 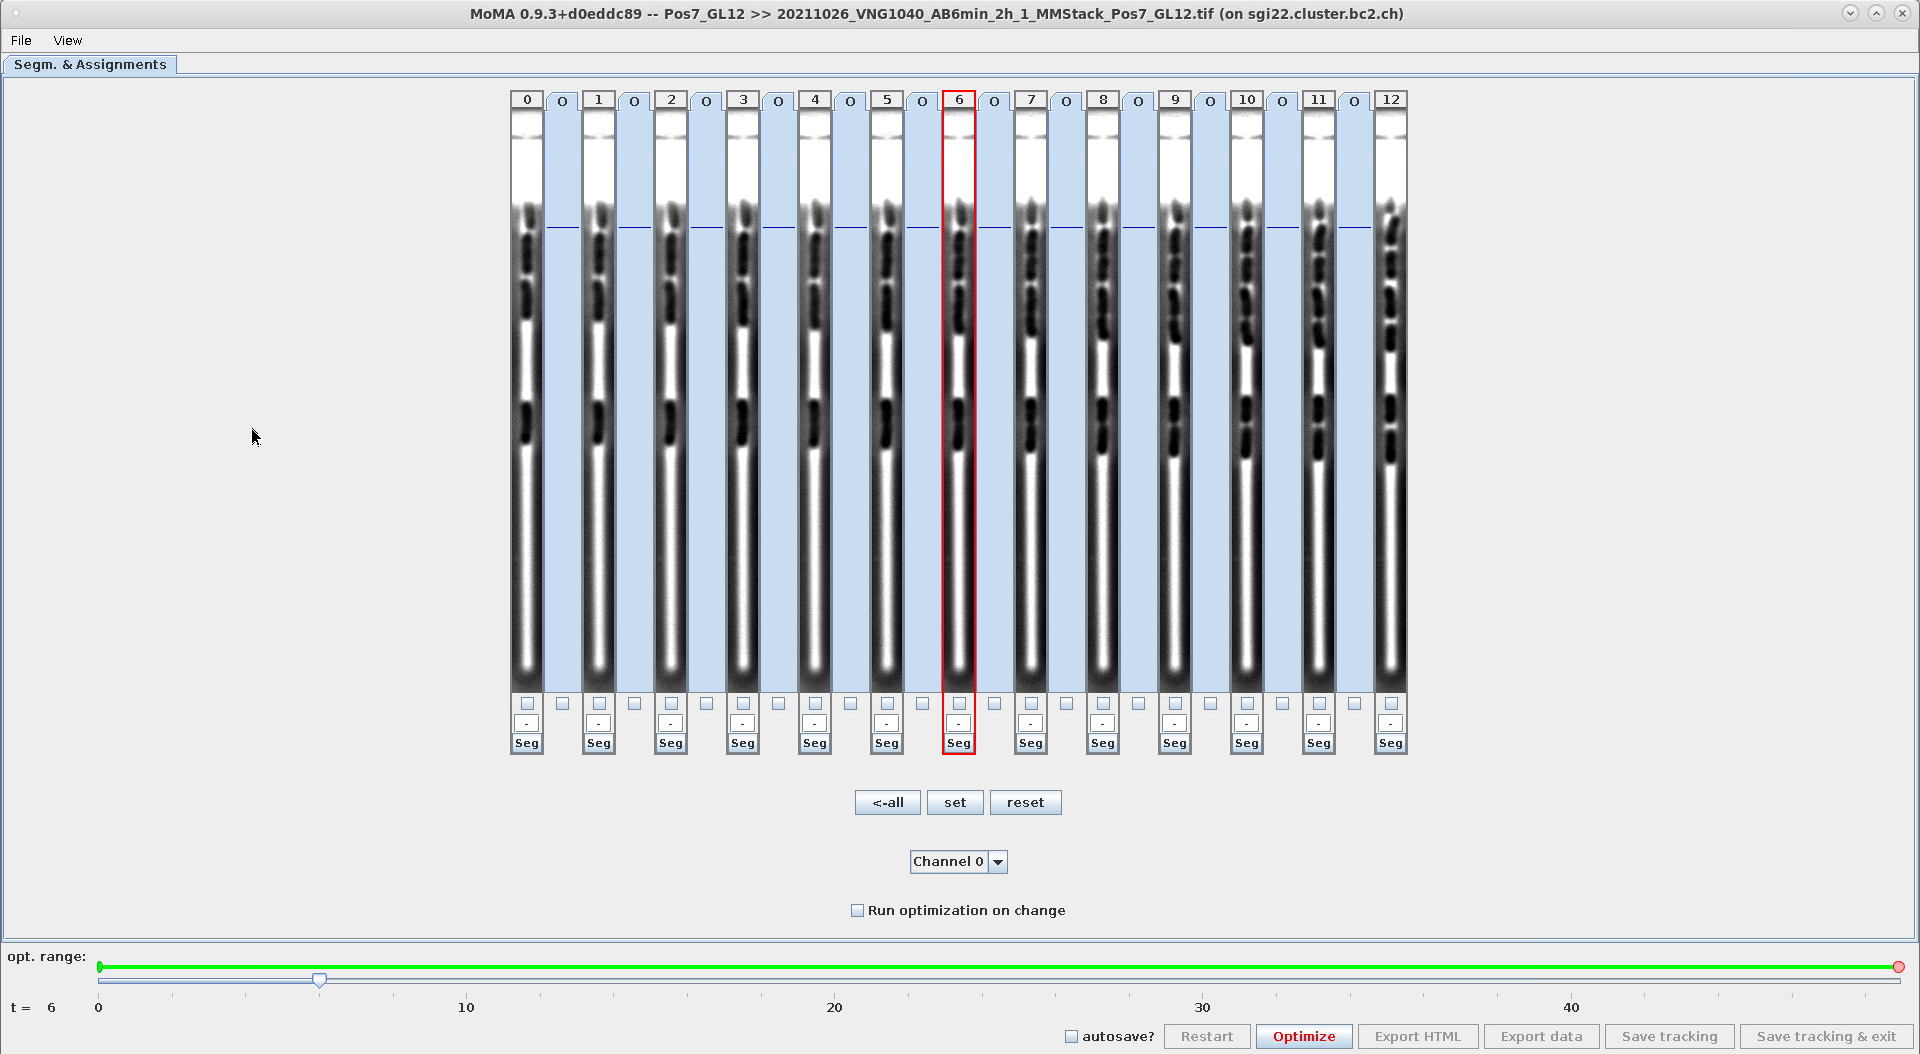
- This setting affects the optimization behavior, when modifications are made to the tracking (e.g. assignments or components are forced or ignored, etc.).
- Options:
-
GUI_OPTIMIZE_ON_ILP_CHANGE=1: The optimization will run for every change done by the user. -
GUI_OPTIMIZE_ON_ILP_CHANGE=0: The optimization will only run, when the user clicks theOptimizebutton or hits the shortcut keyo.
-
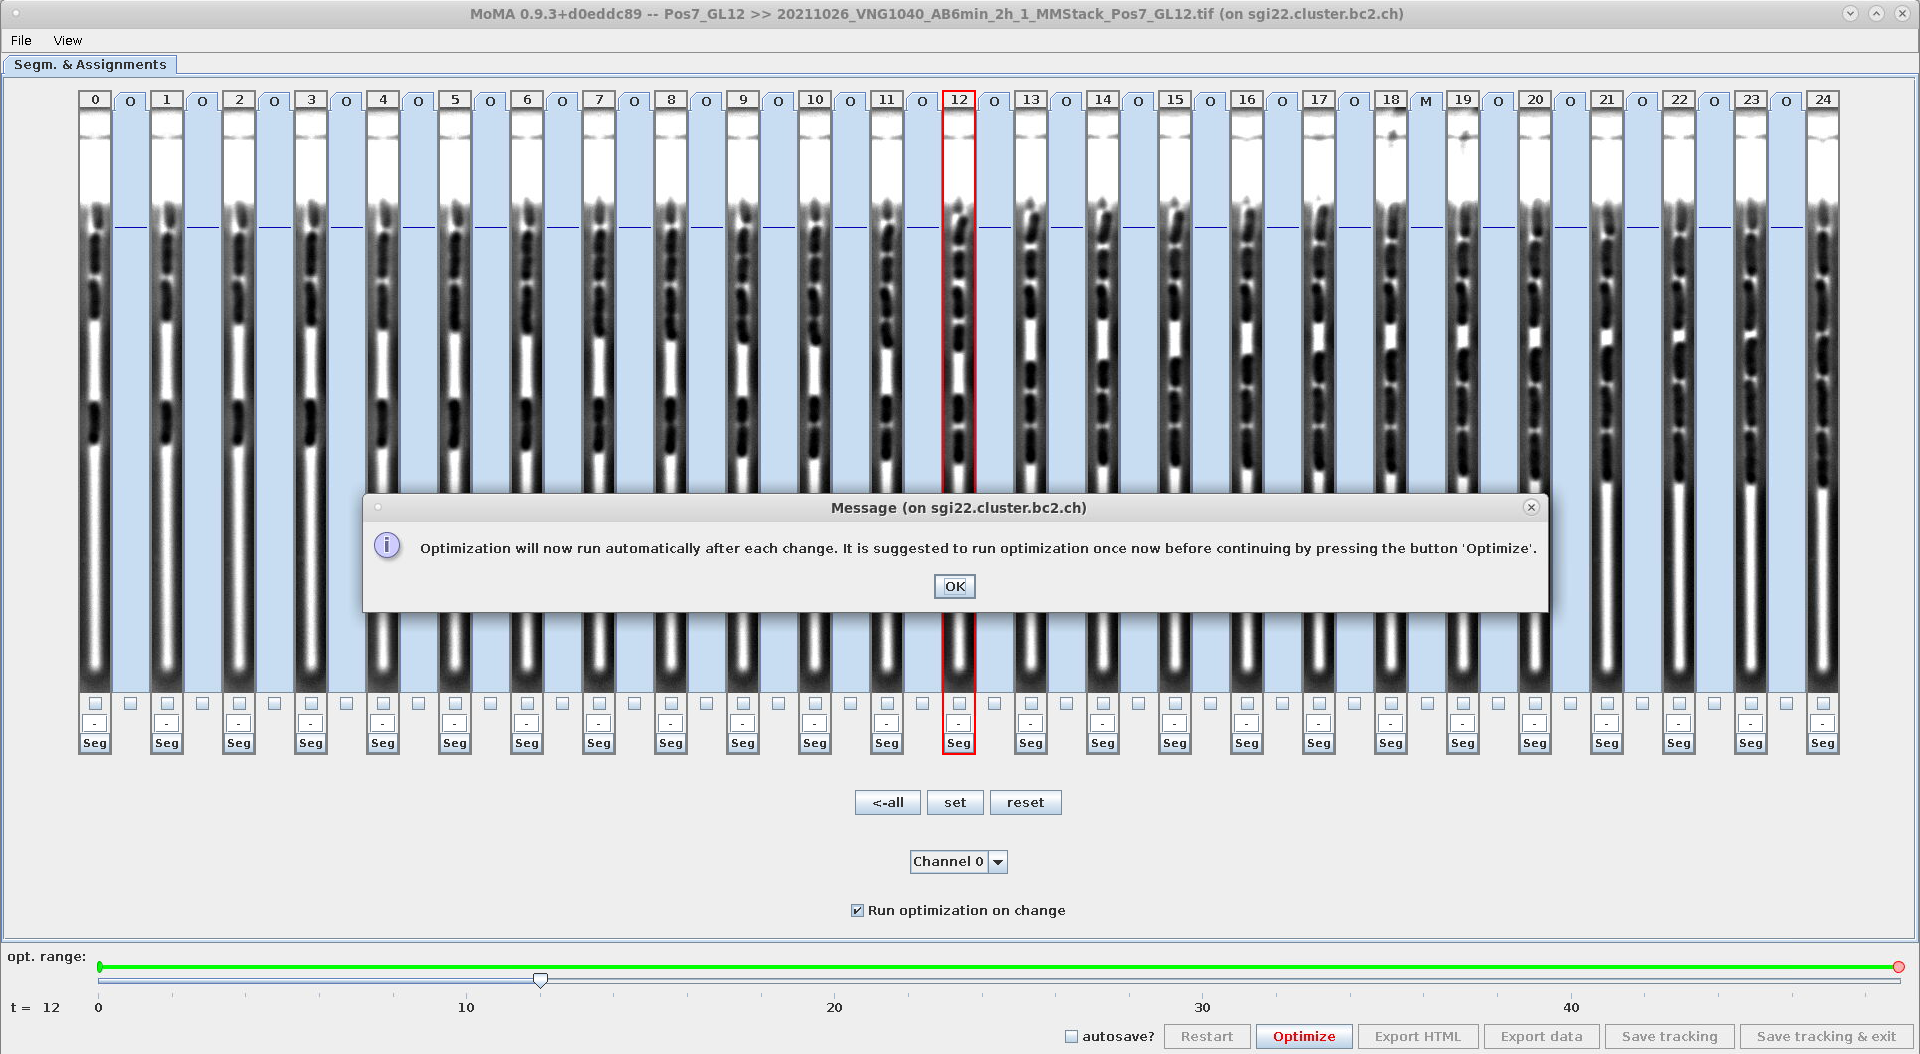
- This setting can be modified in the GUI and changes are stored in
mm.properties:Setting GUI_OPTIMIZE_ON_ILP_CHANGE=0from within the GUISetting GUI_OPTIMIZE_ON_ILP_CHANGE=1from within the GUI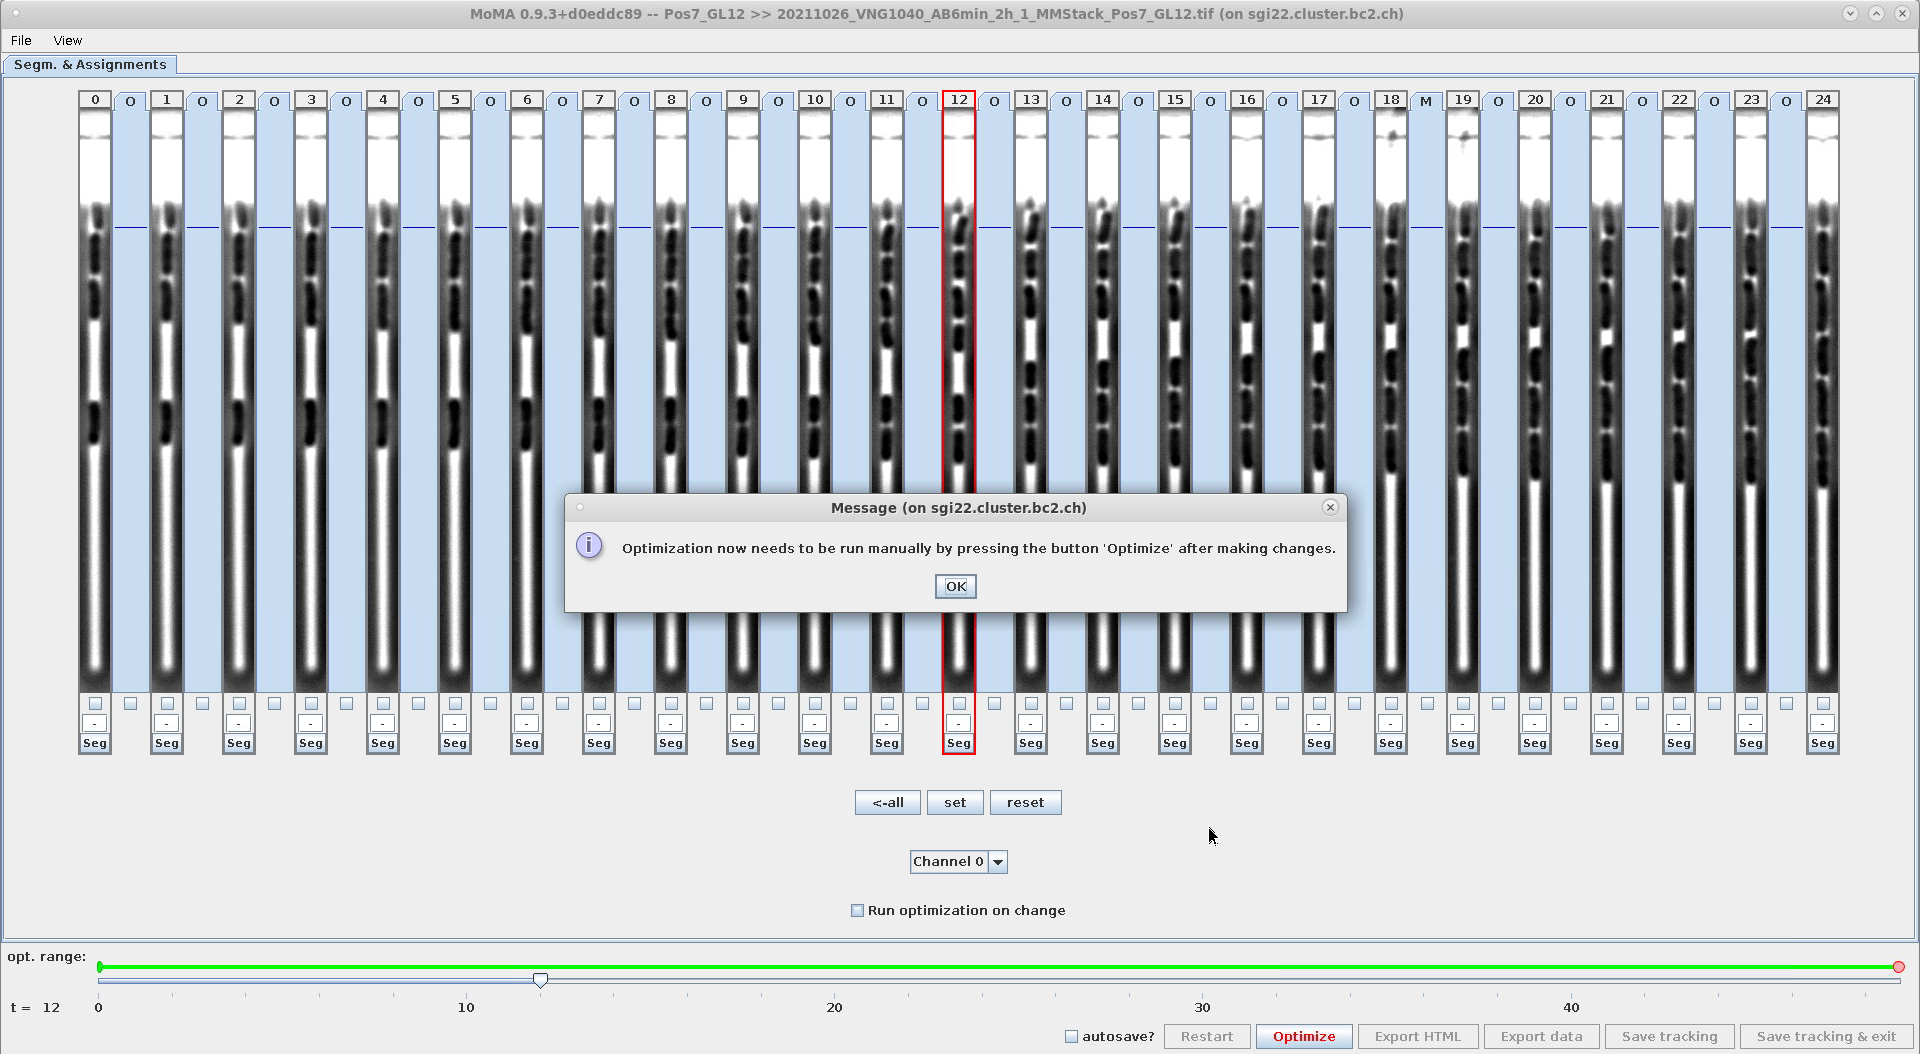
-
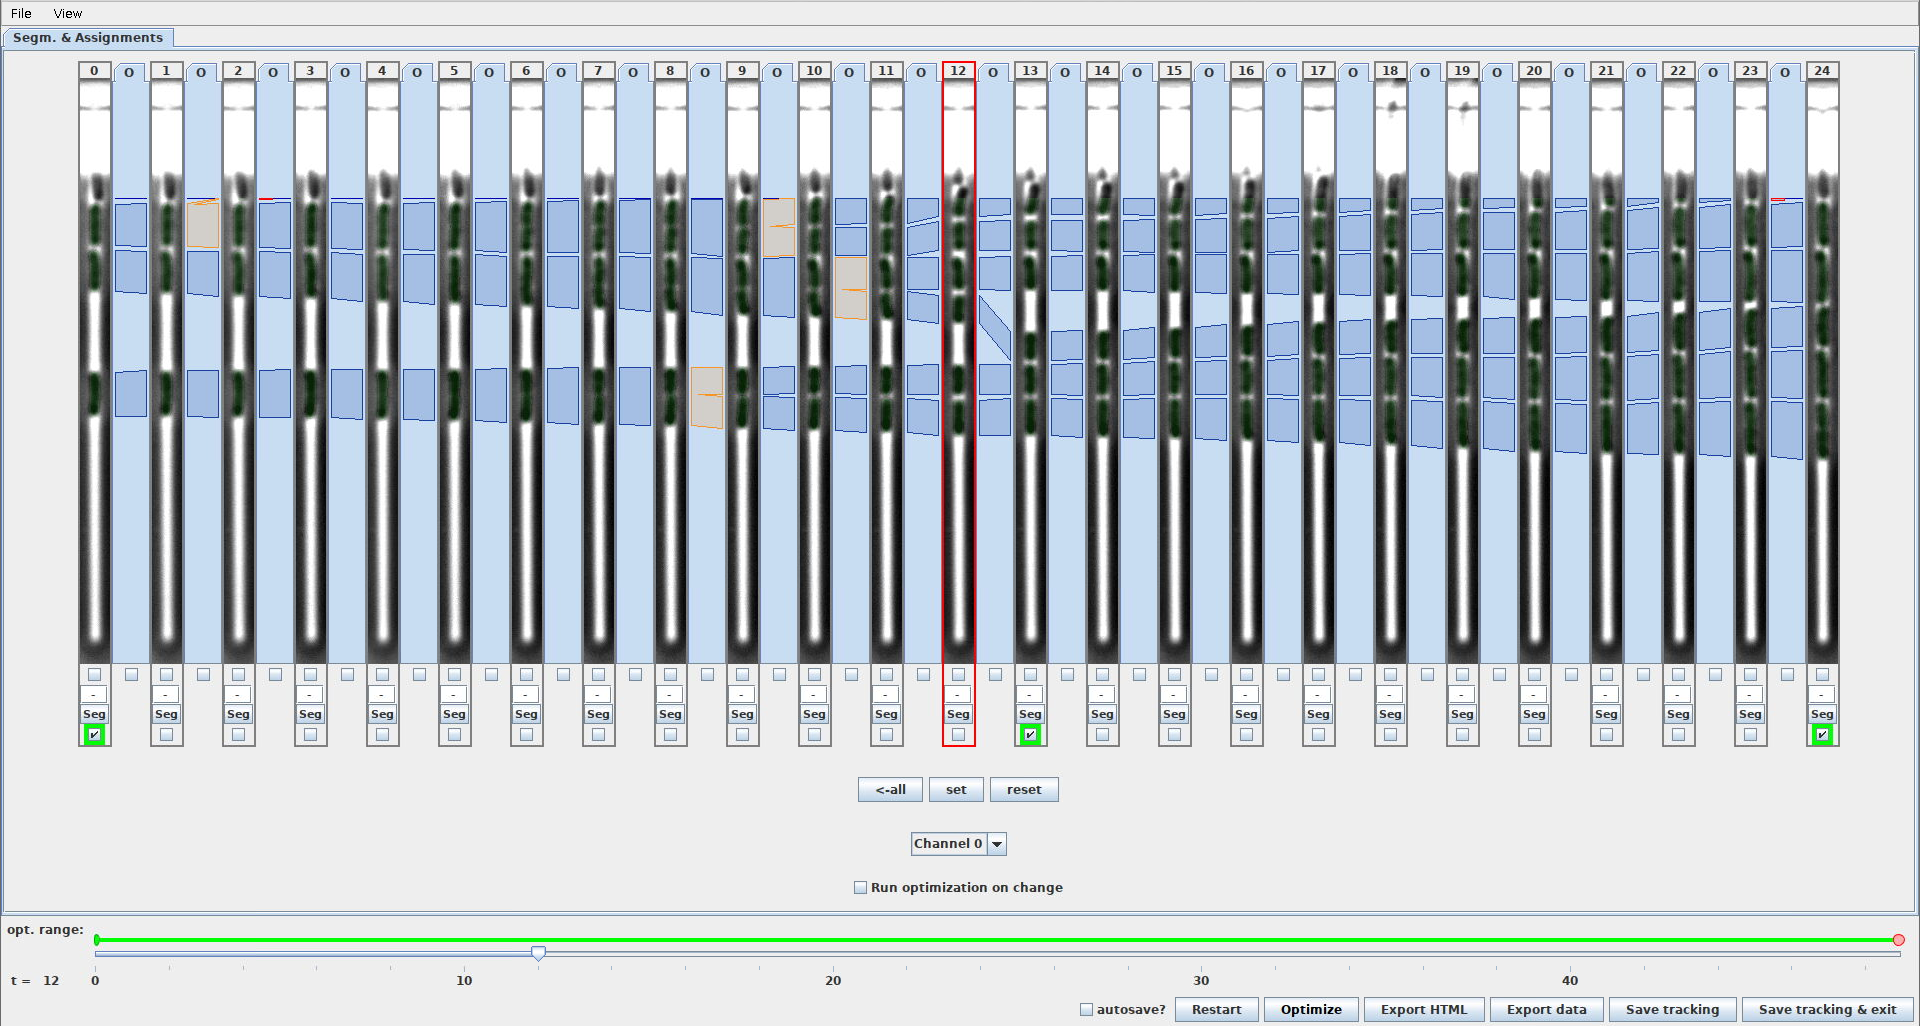
This setting controls, if the export functionality for exporting ground-truth masks is shown in the GUI. When this setting is enabled, the GUI will look like this
GUI_SHOW_GROUND_TRUTH_EXPORT_FUNCTIONALITY=0hides checkboxes to select frames for ground-truth exportGUI_SHOW_GROUND_TRUTH_EXPORT_FUNCTIONALITY=1shows checkboxes to select frames for ground-truth export (note the 3 checkboxes with green outline)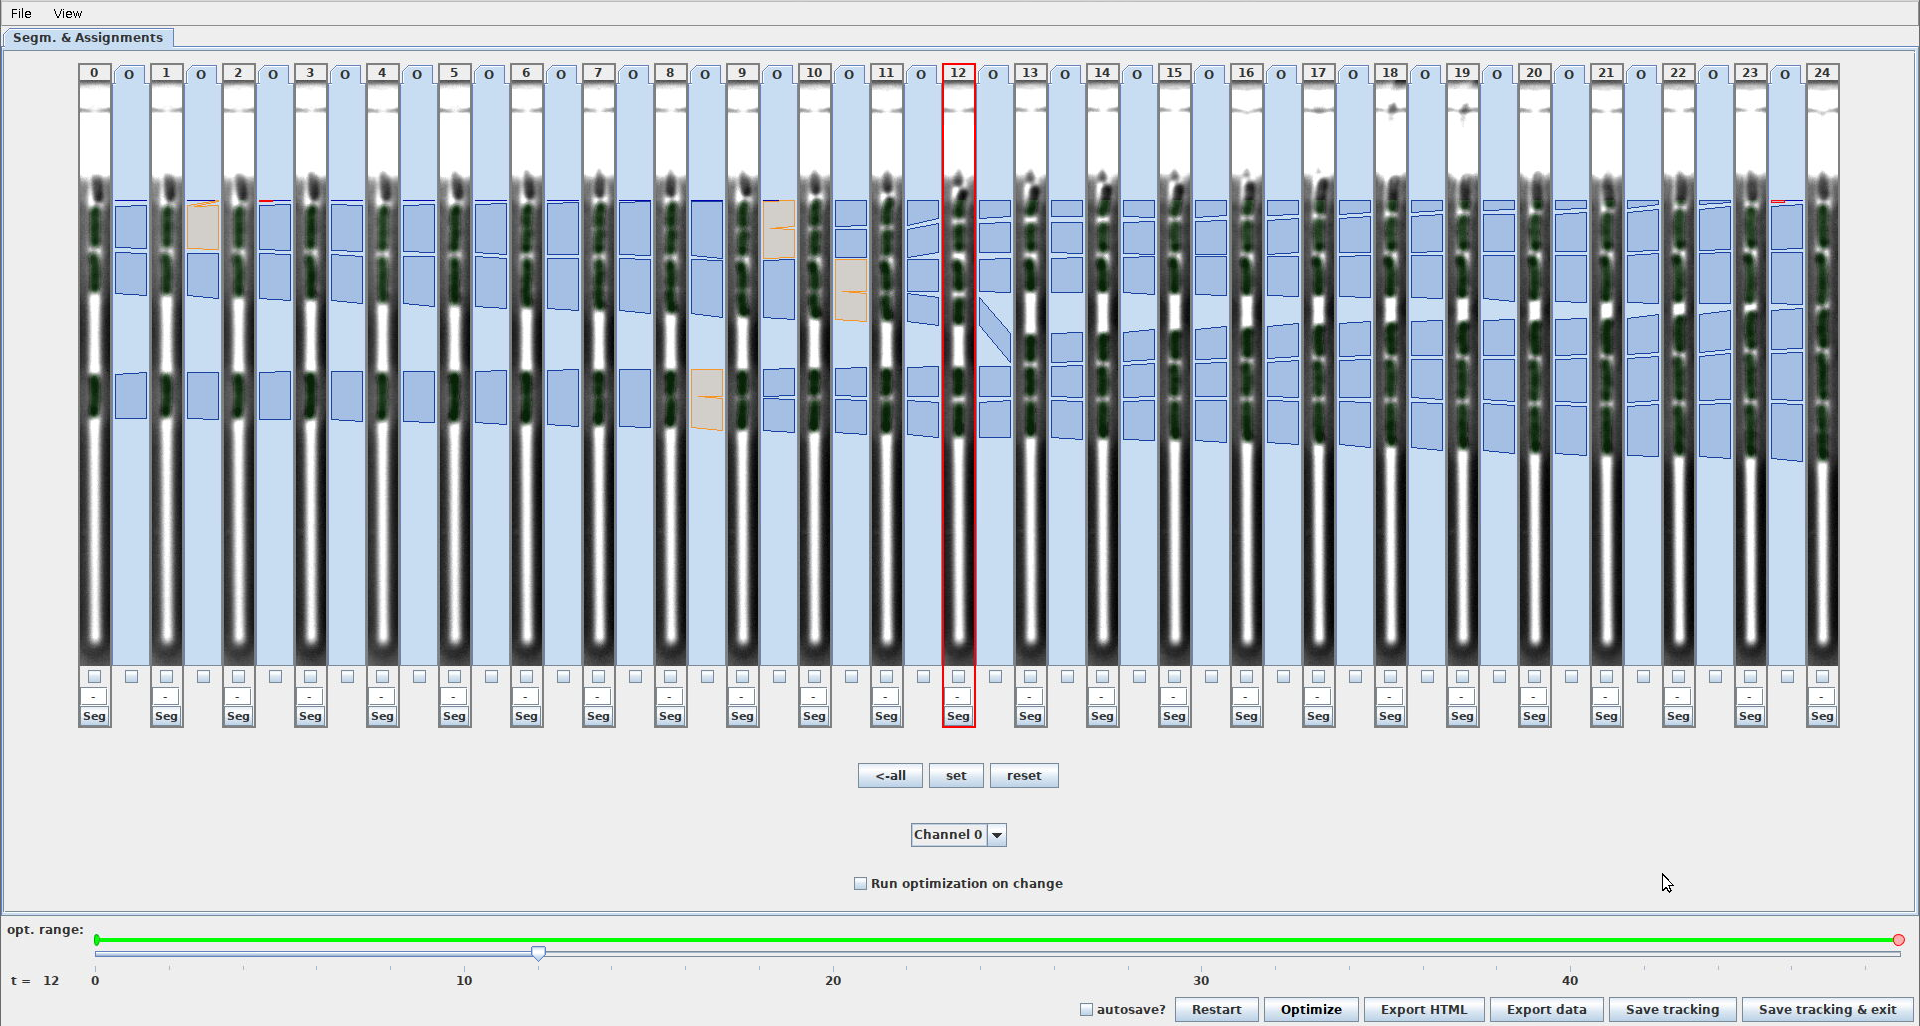
-
During export the indexes of the selected frames will be exported to a CSV file within the export folder called
GroundTruthFrames__{GL_FILE_NAME}.csv. For the example shown in the right screenshot its contents looks like this:input_image="/home/micha/Documents/01_work/15_moma_notes/02_moma_development/documentation/20230706-document-the-settings-in-mm-properties/20211026_VNG1040_AB6min_2h_1_MMStack_Pos7_GL12.tif" ground_truth_mask_image="/home/micha/Documents/01_work/15_moma_notes/02_moma_development/documentation/20230706-document-the-settings-in-mm-properties/test_batch_run/export_data__test_batch_run/CellMasks__20211026_VNG1040_AB6min_2h_1_MMStack_Pos7_GL12.tif" time_step 0 14 26Here,
input_imageis the path to the input TIFF that was processed by MoMA,ground_truth_mask_imageis the path to the TIFF containing the corresponding ground truth masks, and thetime_stepcolumn contains the selected frame-indices.
- This setting controls the labels that are available with the Label Editor (accessible by clicking:
Ctrl+Shift+Right-Clickon a cell). - The following characters must not be used in a label:
whitespace,tab,;,,,/,: - Each label will create a column with binary indicator values in the export file:
CellStats__*.csv, where1indicates that the cell was selected and0indicates that the cell was not selected. The column name will consist of the label name prepended withlabel:, e.g.:- For these labels (also used in the screenshot below):
CELL_LABELS=curation;termination;dying;fading;shrinking;dividing
The column header names in the CSV file are:
label:curation,label:termination,label:dying,label:fading,label:shrinking,label:dividing
- For these labels (also used in the screenshot below):
- Example configuration and how it affects the Label Editor inside the GUI:
Screenshot of the Label Editor with the following labels defined in mm.properties:CELL_LABELS=curation;termination;dying;fading;shrinking;dividing
- This setting controls the width of the GL views. It allows you to adjust the width of the GL view to the width of the GL being shown.
- The unit is in pixels of the image itself.
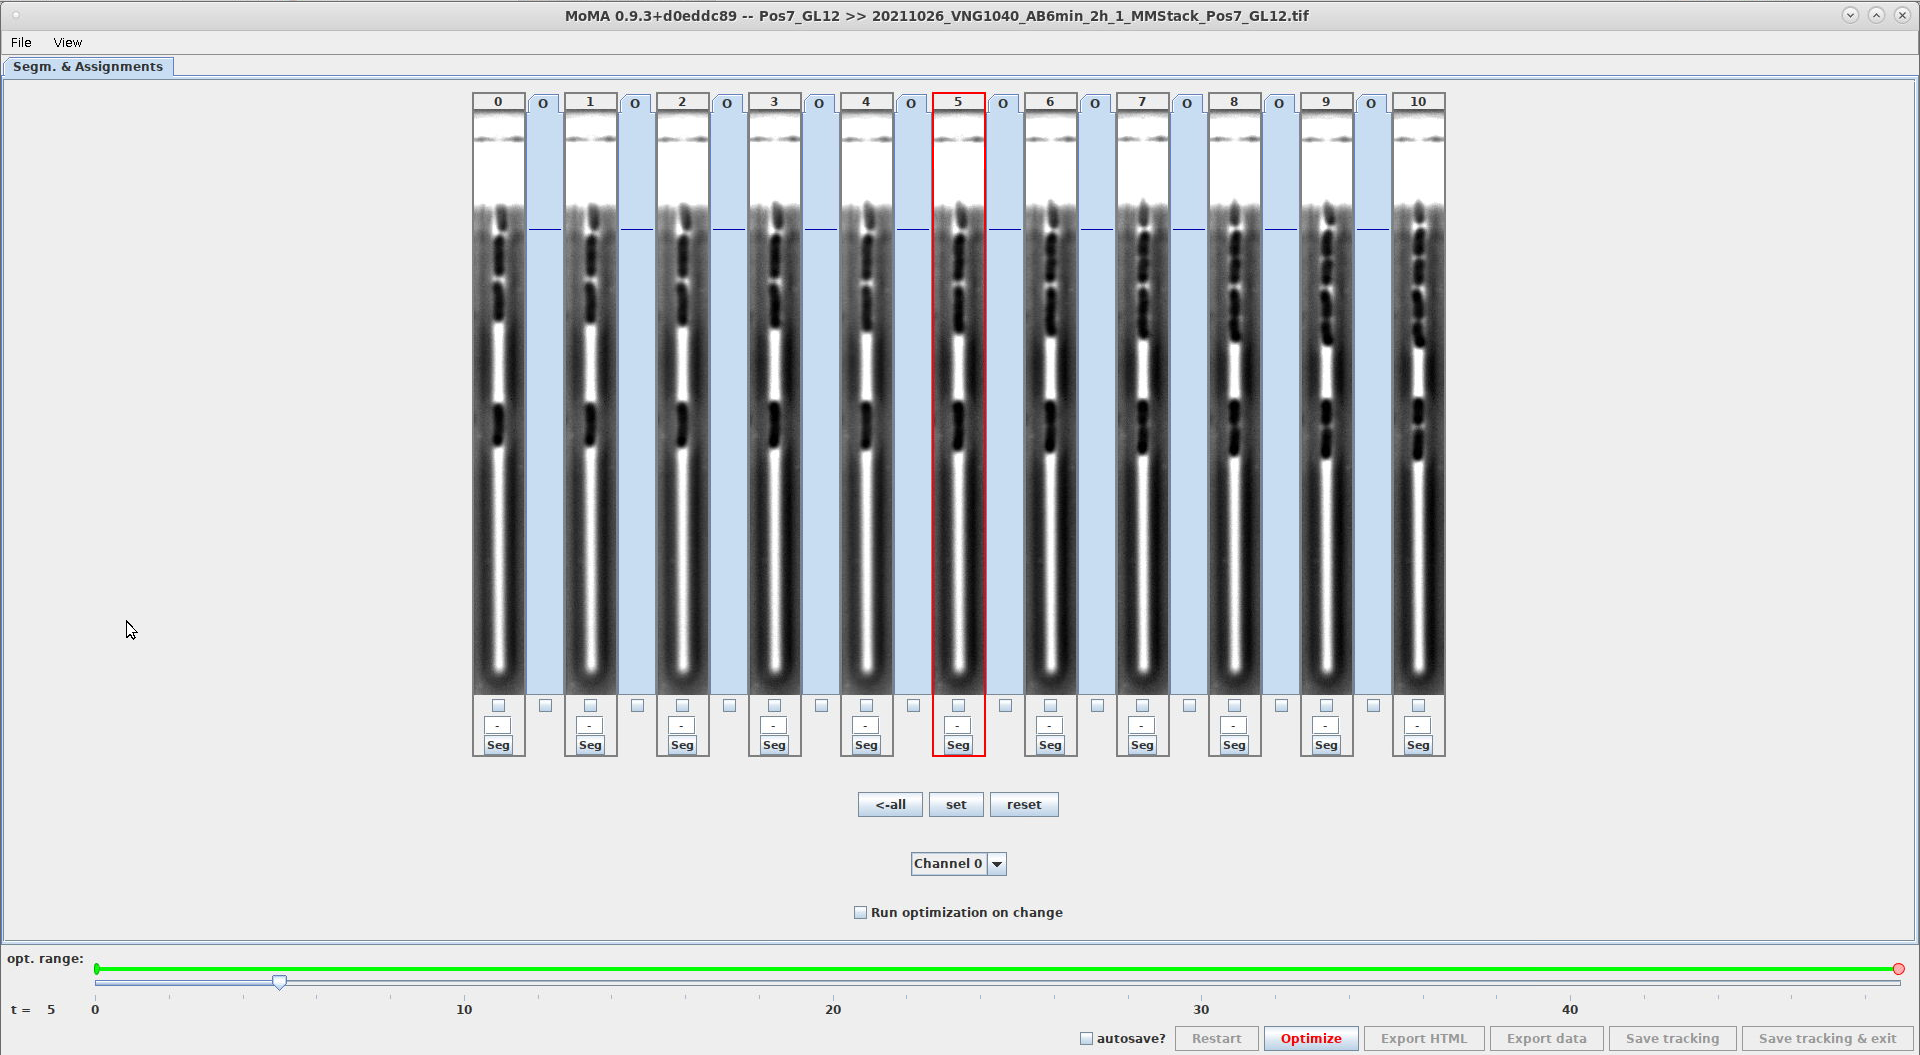
- Example comparing the width of
20and40withGUI_NUMBER_OF_SHOWN_TIMESTEPS=11. The GL view on the right are twice as wide, showing more of the image:GL_WIDTH_IN_PIXELS=20GL_WIDTH_IN_PIXELS=40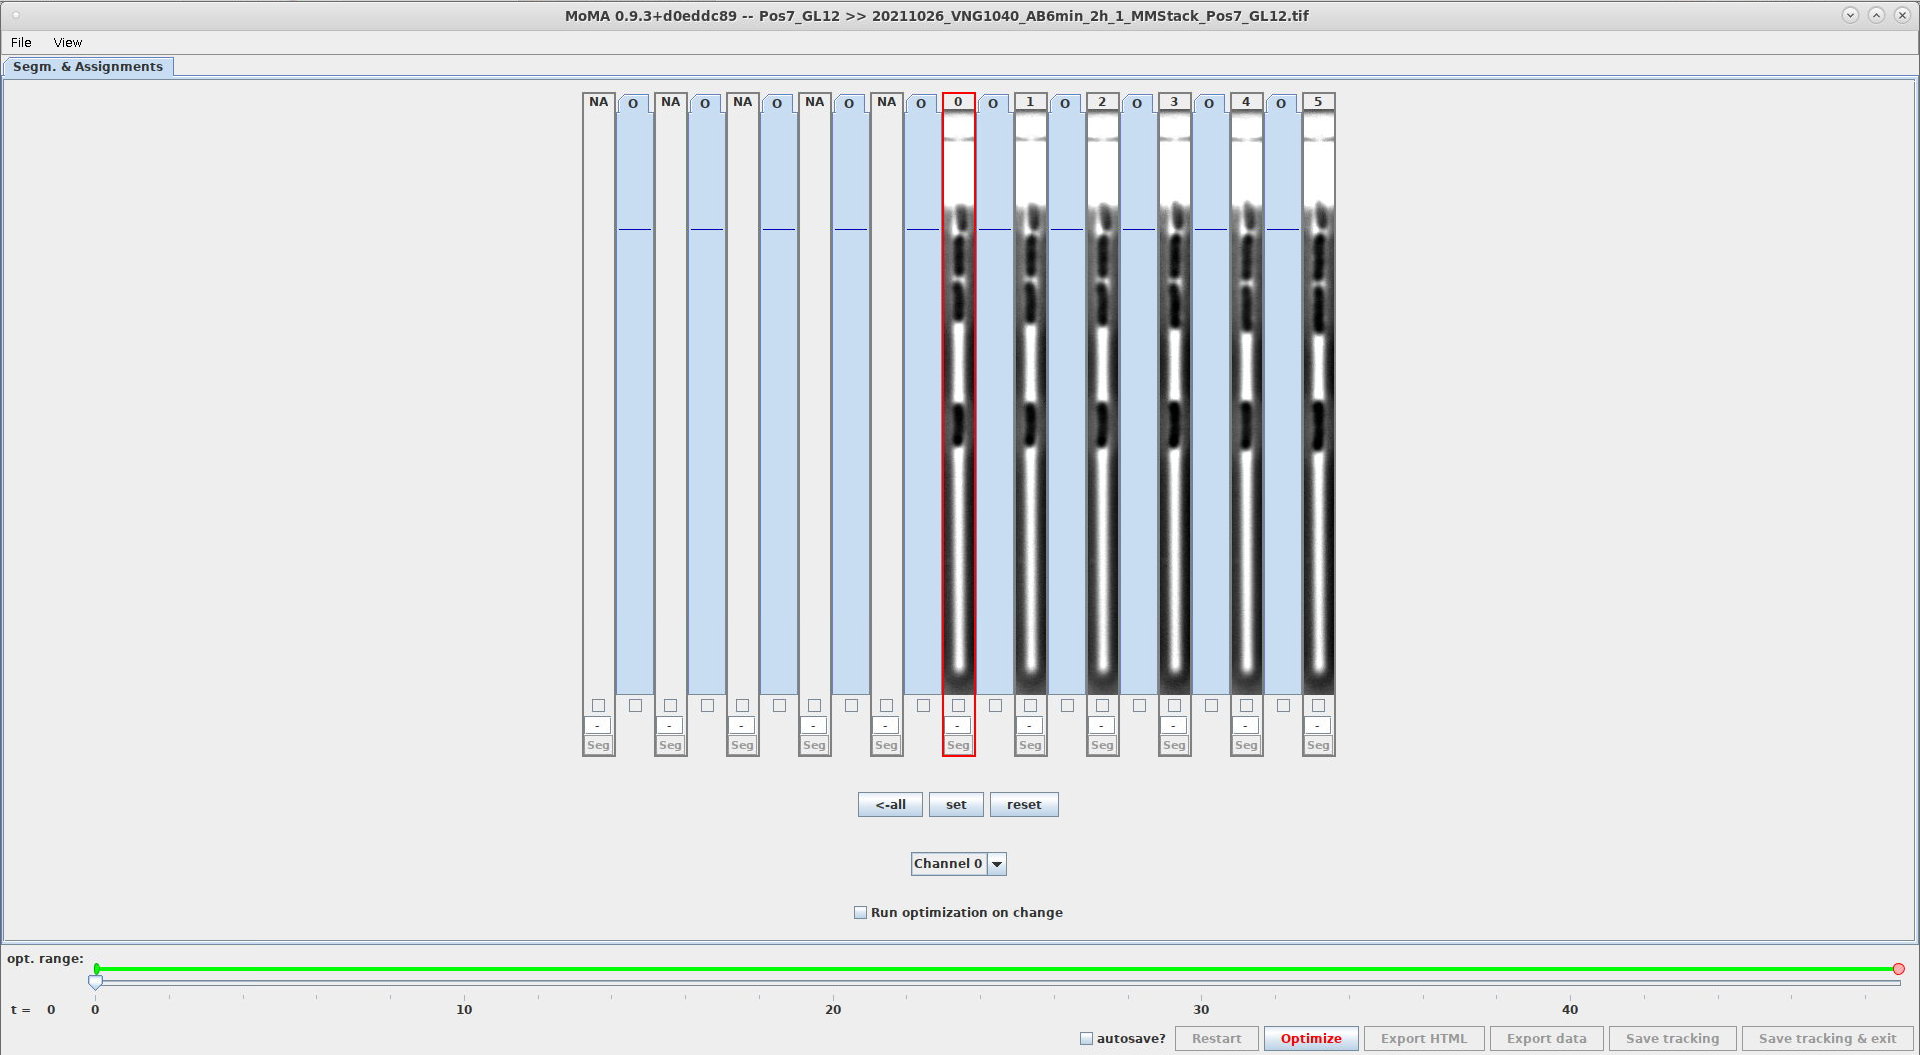
-
These settings store the GUI state. They are overwritten by MoMA and should not be modified manually within
mm.properties:GUI_CONSOLE_WIDTH=600 # width of MoMA console window GUI_HEIGHT=1173 # MoMA window height GUI_WIDTH=1920 # MoMA window width GUI_POS_X=0 # x-position of top left corner of MoMA window GUI_POS_Y=27 # y-position of top left corner of MoMA window
-
WARNING: This value is set by MoMA and should not be changed.
-
This is the path that was passed to MoMA with the option
-i; e.g.:moma -i /path/to/image_file.tiff
-
This path is used to read the image file when loading of a saved tracking result.
-
WARNING: This value is set by MoMA and should not be changed.
-
Index of the first time-step of the TIFF file in the tracking.
-
Corresponds to the value that was passed to MoMA with the option
-tmin; e.g.:moma -tmin 10 -i /path/to/image_file.tiff
-
WARNING: This value is set by MoMA and should not be changed.
-
Index of the last time-step of the TIFF file used in the tracking.
-
Corresponds to the value that was passed to MoMA with the option
-tmax; e.g.:moma -tmax 480 -i /path/to/image_file.tiff
- Path to the ZIP-file of the TensorFlow model.
-
This parameter sets the upper boundary of the image region where U-Net will detect cells.
-
Value is specified in pixels of the input image.
-
Example comparing a setting of
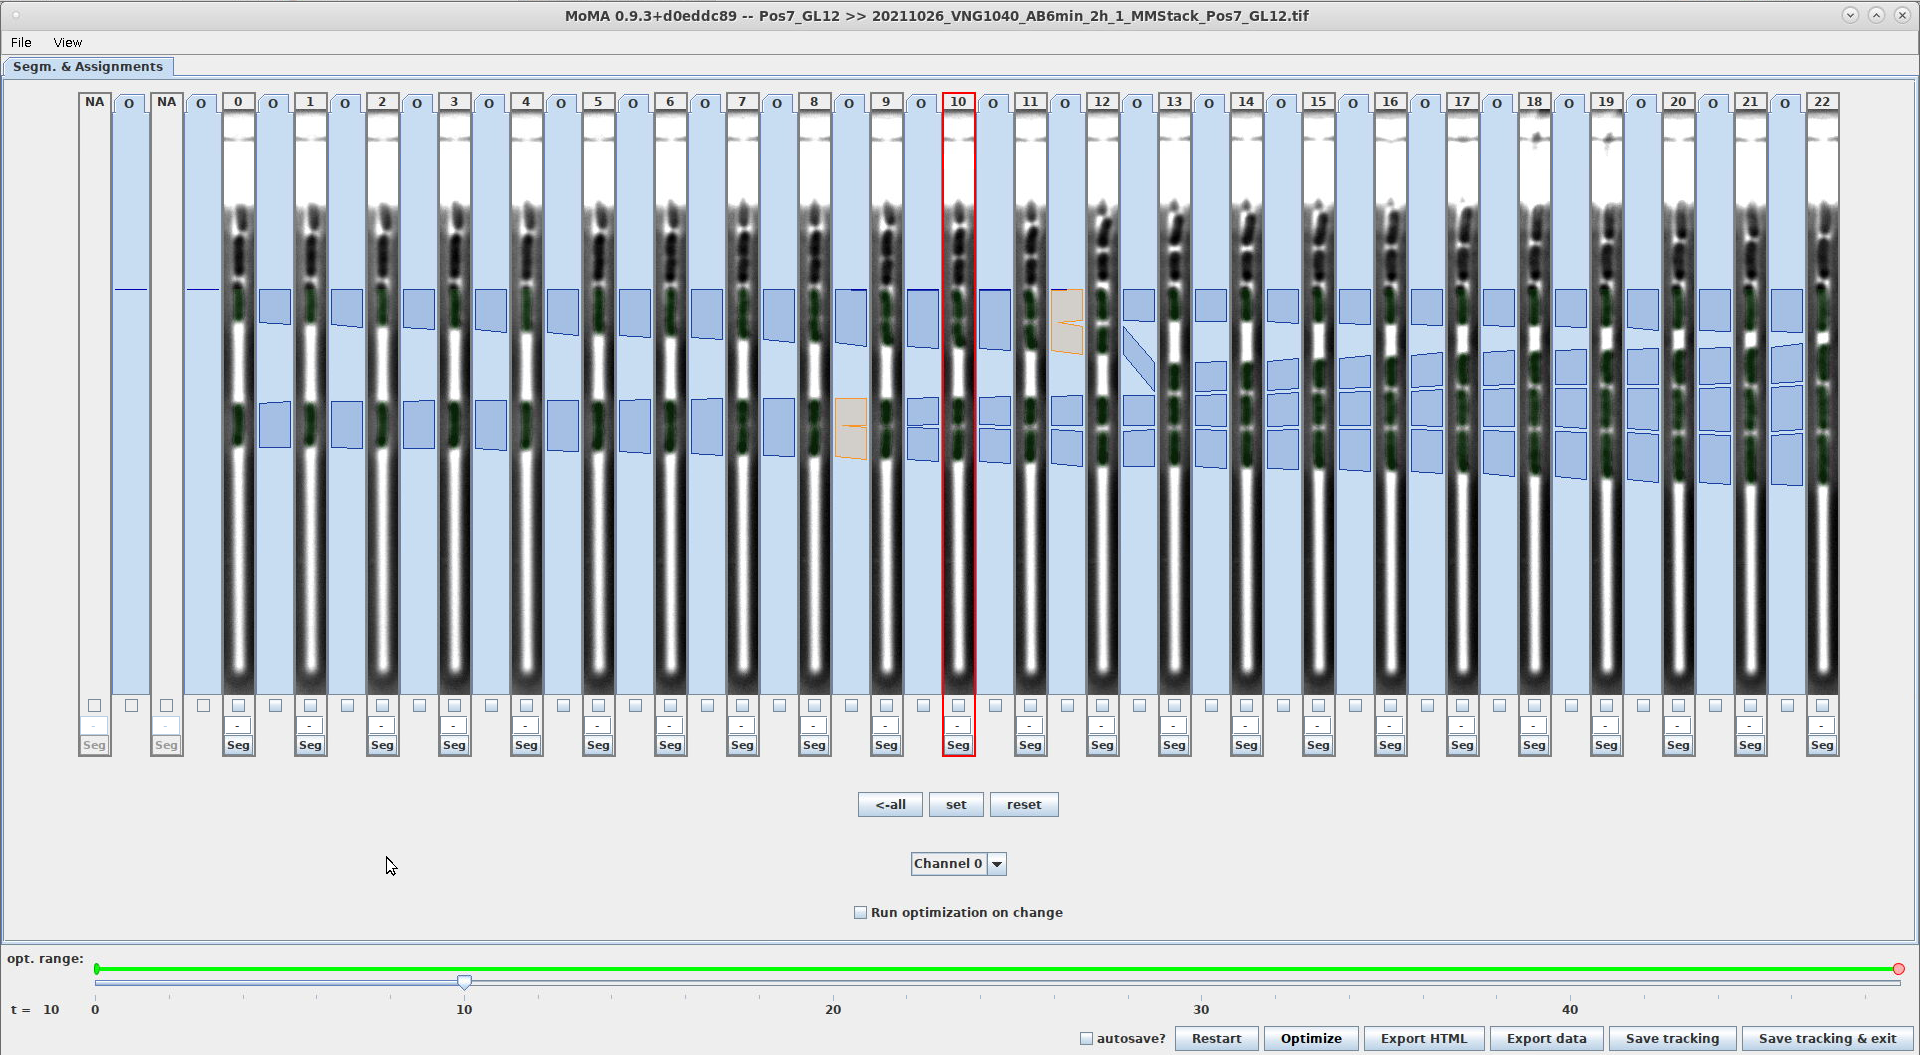
120and180. Note that the region where cells are detected starts at a lower position in the screenshot on the right, which is also indicated by the horizontal, blue line:CELL_DETECTION_ROI_OFFSET_TOP=120CELL_DETECTION_ROI_OFFSET_TOP=180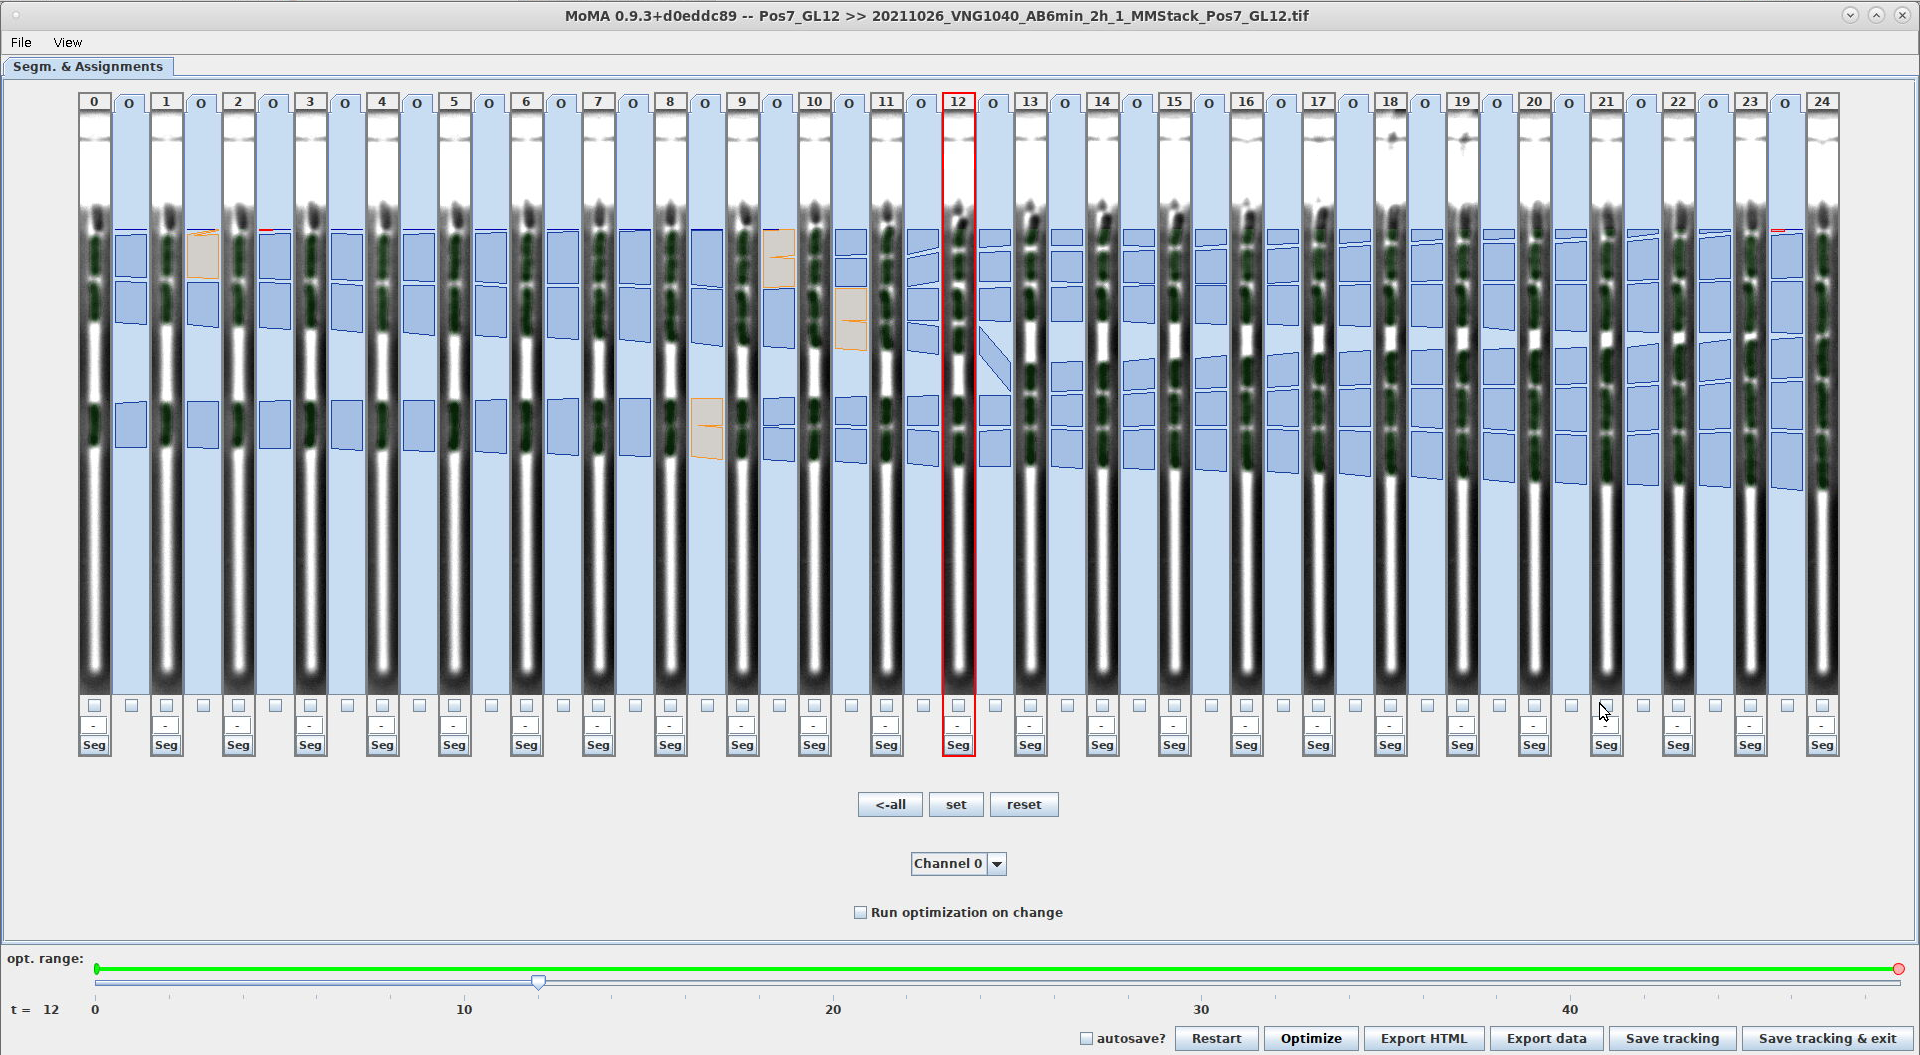
- This value controls the threshold that is applied to the probability map to generate the binary mask of connected components.
- Pixels with value above this threshold will be considered part of a cell. Pixels with value below are considered background.
- This value should not be changed from the default of .5, because it affects the measured cell-area/-size.
- This value controls whether adjacent connected components in the binary mask will be merged during a post-processing step that is performed after thresholding the probability map.
- When to use this setting:
- This value is useful when tracking filamenting cells, where U-Net model can produce probability values below the default threshold (
THRESHOLD_FOR_COMPONENT_GENERATION=0.5). This will cause over-segmentation of these cells and leads to tracking-errors. - By setting e.g.
THRESHOLD_FOR_COMPONENT_MERGING=0.1, MoMA will still generate a connected component from the over-segmented components, if the probability values between them does not fall below0.1. This additional component allows for correct tracking.
- This value is useful when tracking filamenting cells, where U-Net model can produce probability values below the default threshold (
- Suggested value:
THRESHOLD_FOR_COMPONENT_MERGING=0.1was empirically found to be a good starting value was. However, this value will depend on the cell appearance and image, as well as the U-Net model that is used for processing. - Description of the merging algorithm:
The algorithm for merging adjacent components is run on the probability map and works as follows:- We start with the top-most components and assume there exists a component below.
- For each pixel column below the upper component the algorithm will test, if all pixel values in that column are larger than
THRESHOLD_FOR_COMPONENT_MERGINGbefore reaching any component below. If all pixel values are larger, then the corresponding pixels are set to 1 in the binary mask. This connects the two components in the binary mask. - This process is iterated for all components below and thus connects all components in the binary mask, which do not have at least one probability value below
THRESHOLD_FOR_COMPONENT_MERGINGbetween each other in each pixel column.
- This threshold sets the maximal probability value above which components will not be split further. For example, with a value of
THRESHOLD_FOR_COMPONENT_SPLITTING=0.9, a component will not be split into child components, if the probability values within that component are>0.9. - Remarks about usage:
- This setting can help to reduce the size of the optimization problem, which is the reason, why it was added. However, it can easily cause tracking errors, when components that are needed for correct tracking are not be generated.
- It is therefore advisable to leave this value at
1.5, which will cause this threshold to never be used, because values in the probability map have max. value of1.
- These screenshots show the effect of using
THRESHOLD_FOR_COMPONENT_SPLITTING:\-
The component of the filamenting cell in frame 78 is split into child components, when using
THRESHOLD_FOR_COMPONENT_SPLITTING=1.5(i.e. when no threshold is applied). WithTHRESHOLD_FOR_COMPONENT_SPLITTING=0.9the child components of the filamenting cell are not generated.THRESHOLD_FOR_COMPONENT_SPLITTING=1.5THRESHOLD_FOR_COMPONENT_SPLITTING=0.9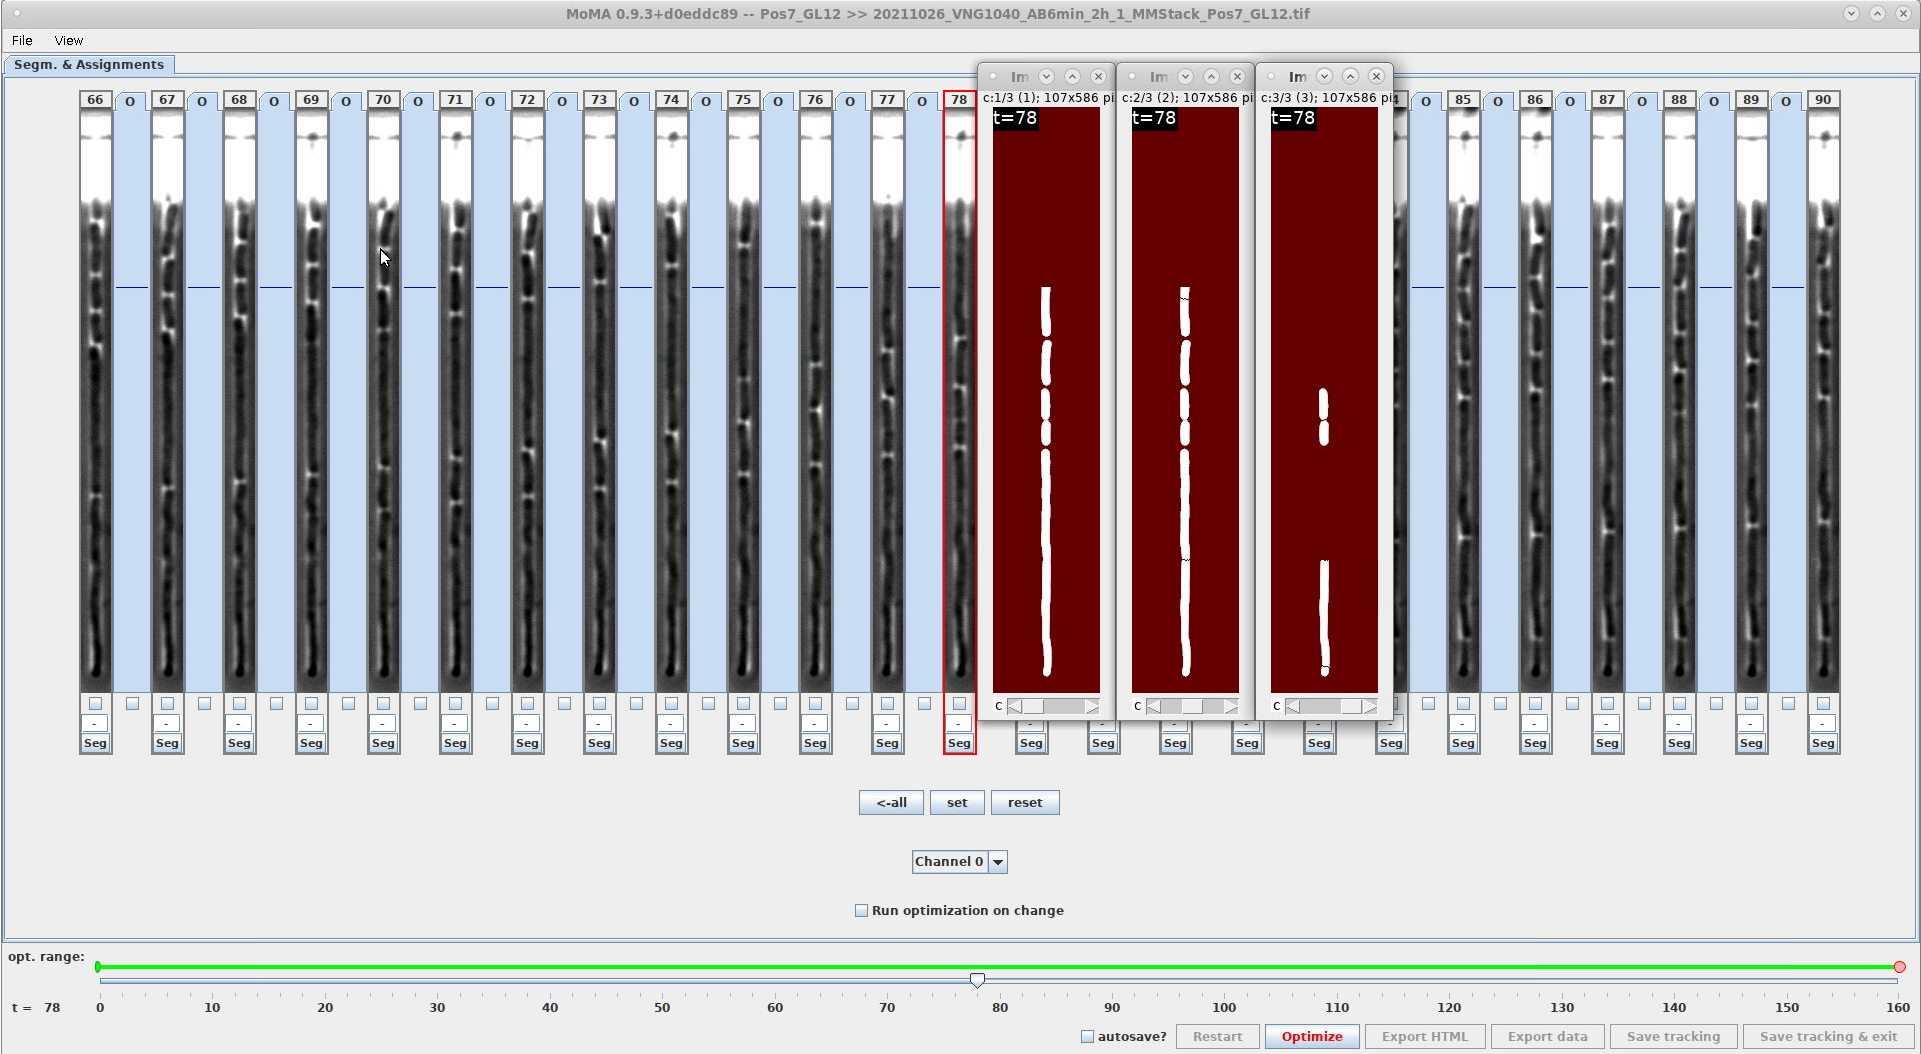

-
- This value sets the maximal allowed component width. Components with larger width are removed.
- Default value [pixel]: 50
- Usage:
- This threshold was added for debugging purposes. It serves to remove components, which have an unreasonably large width. The default value of 50 pixels is ~5x larger than the width of growth-lanes, so that this threshold is never applied, if the U-Net if performing correctly.
- This sets the threshold value for the minimal area of root components in the component-tree. Root components with area smaller than this are removed.
- Default value [pixel]: 10
- Usage:
- This setting can be helpful when facing datasets with fragmenting cells and there exists a minimal expected size for viable cells that you want to track. In this situation, the setting allows you to ignore fragments that are smaller than the minimal expected cell size.
- This sets the threshold value for the minimal area of leaf components in the component-tree. Components with area smaller than this value will not be generated.
- Usage:
- This setting allows you to remove unnecessary components in situations, where there is known minimal cell-size. In this situation any components with an area smaller than the minimal cell-size are due to over-segmentation and increase the size of the tracking problem unnecessarily.
- Default value [pixel]: 10
- Description:
- This sets the threshold for the maximum allowed growth rate. Assignments will only be generated, when the size of source- and target-components fulfill the criterion:
totalTargetComponentLength / sourceComponentLength <= MAXIMUM_GROWTH_RATE,
wheresourceComponentLengthis the length of the source-component andtotalTargetComponentLengthis the total length of the target-components. For the mapping-assignmentstotalTargetComponentLengthis the length of the single target. For division-assignments it is the summed length of the two target-components. The length is determined using the best-fit ellipse. - Assignments that do not fulfill the criterion are not added to the tracking problem.
- This sets the threshold for the maximum allowed growth rate. Assignments will only be generated, when the size of source- and target-components fulfill the criterion:
- Usage:
- This setting can reduce the size of the tracking problem by removing assignments that are infeasible based on the expected maximal growth rate of cells in the experiment.
- Default value: 1.5
- Description:
- This feature-flag determines, if the relative position of source- and target-components will be used in the calculation of the assignment cost.
- Usage:
- By default, the cost-function used by MoMA penalizes the movement of cells within the growth-lane. This can cause tracking errors, when cells move up/down significantly during the experiment. Setting this feature flag to
0deactivates the cost for cell movement, which can improve tracking performance in this situation.
- By default, the cost-function used by MoMA penalizes the movement of cells within the growth-lane. This can cause tracking errors, when cells move up/down significantly during the experiment. Setting this feature flag to
- Options:
-
0: Do not use migration cost. -
1: Use migration cost.
-
- Default value:
1
- Description:
- MoMA can use the fluorescence (FL) intensity of source- and target-components to automatically disable (i.e. force-ignore) assignments, if the difference in average intensities are above/below user-defined thresholds. This section describes the settings for this feature. We refer to it as "assignment filtering".
- The average intensity of a component is defined as the sum of pixel values in the FL channel (set by
FEATURE_FLUORESCENCE_ASSIGNMENT_FILTERING_CHANNEL_NUMBER) within the component mask, divided by the number of pixels in the component (i.e. the component area).
- Usage:
- The FL-based assignment filter is particularly helpful in experiments where cells lyse and lose their FL signal in the process. Lysing cells will often leave cell cadavers and fragments in the growth-lane, which are detected by U-Net in the phase contrast image. Using the FL signal to filter assignments disables most of the assignments between viable cells (with FL signal) and cell cadavers and fragments and significantly reduces curation effort.
- Description:
- This feature flag enable/disables the fluorescence-based filtering.
- Options:
-
0: Filtering is disabled. -
1: Filtering is enabled.
-
- Default value:
1
- Description:
- This is the (0-based) index of the channel within the TIFF-stack, that will is for calculating the fluorescence intensity.
- Default value:
1
- Description:
- This is the lower threshold for the ratio of the average intensities of source- and target-components. An assignment will be automatically disabled, if:
targetComponentIntensityMean/sourceComponentIntensityMean < FEATURE_FLUORESCENCE_ASSIGNMENT_FILTERING_INTENSITY_RATIO_THRESHOLD_LOWERwhere:-
targetComponentIntensityMean: average intensity of the source component -
sourceComponentIntensityMean: average intensity of the target component
-
- This condition is tested separately for both target-components for division-assignments.
- This is the lower threshold for the ratio of the average intensities of source- and target-components. An assignment will be automatically disabled, if:
- Default value:
0.5
- Description:
- This is the upper threshold for the ratio of the average intensities of source- and target-components. An assignment will be automatically disabled, if:
targetComponentIntensityMean/sourceComponentIntensityMean > FEATURE_FLUORESCENCE_ASSIGNMENT_FILTERING_INTENSITY_RATIO_THRESHOLD_UPPERwhere:-
targetComponentIntensityMean: average intensity of the source component -
sourceComponentIntensityMean: average intensity of the target component
-
- This condition is tested separately for both target-components for division-assignments.
- This is the upper threshold for the ratio of the average intensities of source- and target-components. An assignment will be automatically disabled, if:
- Default value:
2.0
- Description:
- This sets the assignment cost for lysis-assignments.
- Usage:
- Lysis assignments are added to the linear program in the same way as other assignment-types (i.e. mapping-assignments, division-assignments, exit-assignments). However, by default their assignment cost is set
10.0, which ensures that they are never selected by the optimizer as part the optimal solution. Thus, the user must force lysis assignments manually during curation. - Manual selection of lysis assignments is enforced by default, because allowing for automatic selection of lysis assignments (by e.g. setting
LYSIS_ASSIGNMENT_COST=0.0) causes many tracking errors (also in the absence of lysis). Moreover, these tracking errors can be hard to detect visually.
- Lysis assignments are added to the linear program in the same way as other assignment-types (i.e. mapping-assignments, division-assignments, exit-assignments). However, by default their assignment cost is set
- Default value:
10.0
- Description:
- This setting disables/enables the use of crossing constraints in the tracking problem.
- Options:
-
0: enabled -
1: disabled
-
- Usage:
- When this setting is enabled, the constraints are added to the ILP to prohibit that assignments can cross each other. This enforces the physical reality, that cells can never pass each other within growth-lanes.
- This setting is disabled by default, because it can increase optimization times significantly, while it only marginally improving tracking performance.
- Default value:
0
- Description:
- This sets the time limit for optimizing the linear program. If the Gurobi optimizer does not find a solution that fulfills
GUROBI_MAX_OPTIMALITY_GAPwithin this time, then it will return the best solution found thus far. - This time limit is used, when optimization is run during the first optimization of the linear program. When instead, optimization is run from within the GUI during curation (i.e. when clicking the 'Optimize' button), the time limit is set by the config parameter
GUROBI_TIME_LIMIT_DURING_CURATION.
- This sets the time limit for optimizing the linear program. If the Gurobi optimizer does not find a solution that fulfills
- Usage:
- Optimization times can vary strongly between datasets. It is therefore to test optimization times for your experiment. These are rough estimates for picking a sane starting values:
- For experiments with exponentially growing cells, ~8 cell per growth-lane, and ~800 frames,
GUROBI_TIME_LIMIT=60has been found sufficient to allow optimization to finish. - For experiments with heavy cell lysis (e.g. as for some antibiotic treatments, that which cause cell fragments), ~8 cell per growth-lane, and ~800 frames,
GUROBI_TIME_LIMIT=180(ie. 3 minutes) has been found as reasonable value, that allows most of the GLs to finish optimization.
- For experiments with exponentially growing cells, ~8 cell per growth-lane, and ~800 frames,
- Optimization times can vary strongly between datasets. It is therefore to test optimization times for your experiment. These are rough estimates for picking a sane starting values:
- Default value [second]:
60.0
- Description:
- This sets the time limit for optimizing the linear program during curation within the GUI (i.e. when clicking the 'Optimize' button).
- Using this value allows setting a shorter time limit than
GUROBI_TIME_LIMITto reduce waiting times during interactive curation. - Note: During interactive curation Gurobi optimizes using the previous solution as starting point. This significantly reduces optimization time, so that a lower value for
GUROBI_TIME_LIMIT_DURING_CURATIONusually still allows Gurobi to finish optimization.
- Usage:
-
For challenging datasets setting
GUROBI_TIME_LIMIT_DURING_CURATIONtoo low can cause the optimizer to not find a near-optimal solution within this time limit. The provided tracking can then be very far off from the expected solution. You can then experience the following behavior:- You load a pre-tracked growth-lane (e.g. when using batch-tracking) with good initial tracking result.
- You make manual modifications to the tracking (e.g. force an assignment, etc.).
- You re-optimize (i.e. when clicking the 'Optimize' button).
- After re-optimizing, the provided solution is obviously wrong and (maybe) many cells are not considered in the tracking solution.
In this situation, try increasing
GUROBI_TIME_LIMIT_DURING_CURATIONobserving such behavior.
You can also try reducing the optimization range slider in the GUI to confine optimization around the time-range, where you made modification.
-
- Default value [second]:
15.0
- Description:
-
The fluorescence intensity of cells perpendicular to the Growth lane is described well by a Cauchy distribution that extends into the region of the PDMS to either side of the growth lane. MoMA can fit this distributions using using expectation maximization to estimate the fluorescence intensity. This method is described in the paper here (see section: "Cell fluorescence estimation")

where
iis the horizontal position,imidis the center of the peak,wits width,Athe amplitude of the signal, ‘noise’ is the measurement noise, andBthe background fluorescence. In this section we describe the parameters that control this fit.
-
- Description:
- This sets the starting value for
win the equation above.
- This sets the starting value for
- Default value [pixel]: 5.5
- Description:
- This sets the number of fitting-iterations.
- Default value: 1000
- Description:
- Cutoff value for terminating the fit.
- The fit process is terminated, when the total relative error of the fit parameters from consecutive fit iterations falls below this value:
$\frac{|A_j - A_{j-1}|}{|A_j + A_{j-1}|}+\frac{|B_j - B_{j-1}|}{|B_j + B_{j-1}|}+\frac{|\mu_j - \mu_{j-1}|}{|\mu_j + \mu_{j-1}|}+\frac{|w_j - w_{j-1}|}{|w_j + w_{j-1}|} < $INTENSITY_FIT_PRECISION
wherejis the fit iteration index (which is bounded byINTENSITY_FIT_ITERATIONS).
- Default value: 1e-3
- Description:
- This flag sets whether to export the length of the oriented bounding box. The oriented bounding box is the enclosing rectangle with minimal area. The method for calculating it is describe in: H. Freeman and R. Shapira. 1975. Determining the minimum-area encasing rectangle for an arbitrary closed curve. Commun. ACM 18, 7 (July 1975), 409–413.. The code is based on this code from ImageJ.
- Options:
-
0: disable the export -
1: enable the export
-
- Default value:
1
- Description:
- This flag sets whether to calculate the cell area using the probability maps.
- This method uses the cell mask in combination with the probability map to calculate cell size. It produces cell size estimates that are less noisy than calculating cell size using only the cell mask area. It does this by performing the following steps (see also the screenshot below for illustration):
- Erode the cell mask by one pixel. Calculate the number of pixels in the eroded mask. This yields the "core area"
$A_c$ . Let us call this set of pixels$P_C$ . - Dilate the cell mask by one pixel. Let us all this set of pixels
$P_D$ . - Calculate the relative compliment set of pixels between the dilated and the eroded cell masks:
$P_B=P_D \backslash P_C$ . This yields a region (roughly) 2 pixels wide along border of the cell mask. - Sum up pixel values in the probability map for pixels in set
$P_C$ . This yields the "border area"$A_b$ . Note: Pixels in$P_B$ that overlap with pixels in$\tilde{P}_B$ of a neighboring cell are counted$1/2$ . - The total cell area is then defined as:
$A_{cell}=A_c+A_b$
- Erode the cell mask by one pixel. Calculate the number of pixels in the eroded mask. This yields the "core area"
- These example screenshots of a probability map and cell mask undergoing the operations above (note that the probability map also shows the cell below the cell of interest):
probability map cell mask eroded mask: $P_E$ dilated mask: $P_D$ relative compliment: $P_B=P_D \backslash P_C$ 


- Options:
-
0: Do not export the cell size using probability maps. -
1: Export the cell size using probability maps.
-
- Default value:
1
Explanation:
- graphical user interface:
- GUI_NUMBER_OF_SHOWN_TIMESTEPS []
- GUI_OPTIMIZE_ON_ILP_CHANGE: Controls if optimization will be performed on each user-modification during curation.
- GUROBI_TIME_LIMIT: Time limit for the tracking optimization.
- EXPORT_ASSIGNMENT_COSTS: Controls if assignment costs should be exported. This is a developer option and should not be modified.
- THRESHOLD_FOR_COMPONENT_SPLITTING: Sets an upper threshold for component generation. Pixel probabilities above this threshold will be set to 1. Reducing this below 1 can avoid the generation of spurious child components and thus reduce the depth of the component tree, which is particularly useful for dataset with filamenting cells. However, setting this value too low can create issues, when correct child components are not generated. A good initial value is >0.99 when using this option.
- SPINE_MEASUREMENT_POSITION_AVERAGING_MINIMUM_WINDOWSIZE: Minimum windows size for the window averaging the medial line positions in the calculation of the spine-length measurement.
- SPINE_MEASUREMENT_POSITION_AVERAGING_MAXIMUM_WINDOWSIZE: Maximum windows size for the window averaging the medial line positions in the calculation of the spine-length measurement.
- SPINE_MEASUREMENT_MEDIALLINE_OFFSET_FROM_CONTOUR_ENDS: Minimal distance between the end of the medial line and the cell contour at either end of the cell.
- THRESHOLD_FOR_COMPONENT_GENERATION [0.5; DO NOT CHANGE]: The threshold that is used to generate components. This value should not be changed from the default of .5, because it affects the measured cell-area/-size.
- MAXIMUM_DOWNWARD_MOVEMENT: (added in version v0.9.3) This parameter sets by how many pixel a cell is allowed to move downwards. Assignments with a position difference larger than this (between source and target) will not be considered. The unit pixels. If the parameter is not set in the config-file, it will default to 50.